|
Download Data (XLS File) |
|
||||||||
|
||||||||
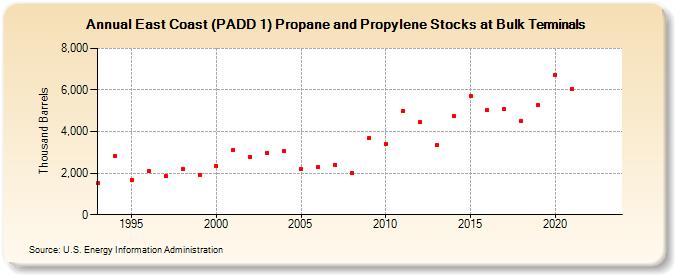
| East Coast (PADD 1) Propane and Propylene Stocks at Bulk Terminals (Thousand Barrels) | ||||||||
| Decade | Year-0 | Year-1 | Year-2 | Year-3 | Year-4 | Year-5 | Year-6 | Year-7 | Year-8 | Year-9 |
|---|---|---|---|---|---|---|---|---|---|---|
| 1990's | 1,503 | 2,825 | 1,683 | 2,100 | 1,866 | 2,222 | 1,923 | |||
| 2000's | 2,339 | 3,103 | 2,791 | 2,991 | 3,075 | 2,193 | 2,314 | 2,404 | 2,011 | 3,679 |
| 2010's | 3,416 | 5,006 | 4,443 | 3,343 | 4,742 | 5,725 | 5,045 | 5,067 | 4,507 | 5,258 |
| 2020's | 6,735 | 6,063 | -- | -- |
| - = No Data Reported; -- = Not Applicable; NA = Not Available; W = Withheld to avoid disclosure of individual company data. |
| Release Date: 3/29/2024 |
| Next Release Date: 8/30/2024 |