|
Download Data (XLS File) |
|
||||||||
|
||||||||
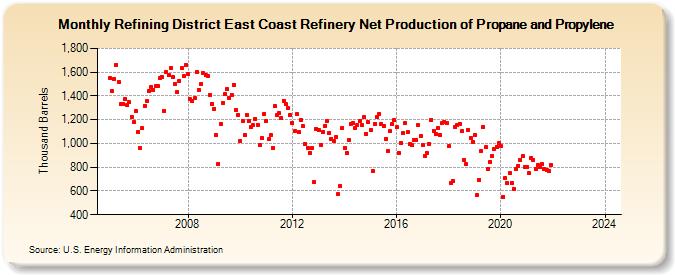
| Refining District East Coast Refinery Net Production of Propane and Propylene (Thousand Barrels) | ||||||||
| Year | Jan | Feb | Mar | Apr | May | Jun | Jul | Aug | Sep | Oct | Nov | Dec |
|---|---|---|---|---|---|---|---|---|---|---|---|---|
| 2005 | 1,548 | 1,441 | 1,546 | 1,663 | 1,518 | 1,331 | 1,329 | 1,373 | 1,320 | 1,345 | 1,225 | 1,179 |
| 2006 | 1,275 | 1,098 | 958 | 1,129 | 1,319 | 1,353 | 1,441 | 1,478 | 1,450 | 1,482 | 1,484 | 1,550 |
| 2007 | 1,562 | 1,276 | 1,602 | 1,576 | 1,636 | 1,556 | 1,502 | 1,434 | 1,528 | 1,632 | 1,564 | 1,662 |
| 2008 | 1,585 | 1,370 | 1,358 | 1,381 | 1,603 | 1,450 | 1,498 | 1,589 | 1,572 | 1,569 | 1,409 | 1,334 |
| 2009 | 1,293 | 1,067 | 829 | 1,164 | 1,343 | 1,415 | 1,458 | 1,384 | 1,411 | 1,496 | 1,280 | 1,243 |
| 2010 | 1,021 | 1,191 | 1,071 | 1,243 | 1,189 | 1,138 | 1,155 | 1,208 | 1,158 | 986 | 1,048 | 1,250 |
| 2011 | 1,190 | 1,034 | 1,070 | 965 | 1,313 | 1,236 | 1,253 | 1,216 | 1,361 | 1,330 | 1,295 | 1,243 |
| 2012 | 1,175 | 1,104 | 1,247 | 1,095 | 1,200 | 1,144 | 998 | 961 | 921 | 962 | 675 | 1,124 |
| 2013 | 1,109 | 991 | 1,095 | 1,150 | 1,192 | 1,091 | 1,041 | 1,022 | 1,050 | 572 | 639 | 1,133 |
| 2014 | 964 | 917 | 1,029 | 1,164 | 1,172 | 1,126 | 1,152 | 1,191 | 1,153 | 1,219 | 1,082 | 1,177 |
| 2015 | 1,111 | 769 | 1,166 | 1,220 | 1,249 | 1,165 | 1,145 | 1,041 | 934 | 1,101 | 1,160 | 1,195 |
| 2016 | 1,137 | 920 | 1,005 | 1,087 | 1,172 | 1,096 | 995 | 986 | 1,029 | 1,030 | 1,151 | 1,062 |
| 2017 | 988 | 895 | 918 | 999 | 1,201 | 1,107 | 1,076 | 1,131 | 1,070 | 1,170 | 1,184 | 1,174 |
| 2018 | 976 | 667 | 682 | 1,135 | 1,159 | 1,166 | 1,102 | 859 | 825 | 1,112 | 1,047 | 1,015 |
| 2019 | 1,071 | 568 | 695 | 938 | 1,140 | 966 | 784 | 845 | 891 | 957 | 970 | 1,004 |
| 2020 | 975 | 553 | 709 | 666 | 749 | 669 | 617 | 789 | 813 | 861 | 892 | 804 |
| 2021 | 803 | 748 | 876 | 860 | 786 | 821 | 800 | 830 | 787 | 779 | 767 | 821 |
| 2022 | -- | -- | -- | -- | -- | -- | -- | -- | -- | -- | -- | -- |
| 2023 | -- | -- | -- | -- | -- | -- | -- | -- | -- | -- | -- | -- |
| 2024 | -- | |||||||||||
| - = No Data Reported; -- = Not Applicable; NA = Not Available; W = Withheld to avoid disclosure of individual company data. |
| Release Date: 3/29/2024 |
| Next Release Date: 4/30/2024 |