|
Download Data (XLS File) |
|
||||||||
|
||||||||
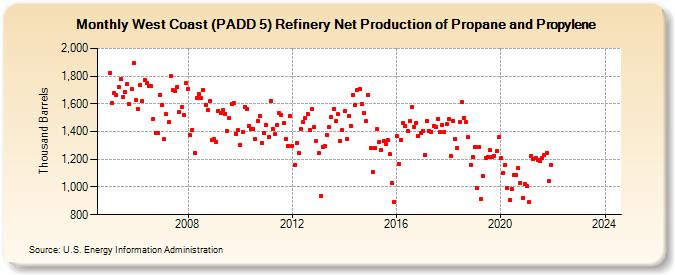
| West Coast (PADD 5) Refinery Net Production of Propane and Propylene (Thousand Barrels) | ||||||||
| Year | Jan | Feb | Mar | Apr | May | Jun | Jul | Aug | Sep | Oct | Nov | Dec |
|---|---|---|---|---|---|---|---|---|---|---|---|---|
| 2005 | 1,826 | 1,604 | 1,675 | 1,667 | 1,718 | 1,777 | 1,651 | 1,687 | 1,740 | 1,600 | 1,704 | 1,891 |
| 2006 | 1,629 | 1,560 | 1,733 | 1,618 | 1,770 | 1,753 | 1,731 | 1,727 | 1,487 | 1,389 | 1,391 | 1,667 |
| 2007 | 1,594 | 1,344 | 1,528 | 1,467 | 1,802 | 1,698 | 1,693 | 1,724 | 1,541 | 1,576 | 1,518 | 1,750 |
| 2008 | 1,709 | 1,374 | 1,414 | 1,246 | 1,645 | 1,670 | 1,639 | 1,703 | 1,592 | 1,555 | 1,621 | 1,337 |
| 2009 | 1,346 | 1,325 | 1,551 | 1,536 | 1,558 | 1,529 | 1,403 | 1,499 | 1,597 | 1,607 | 1,383 | 1,408 |
| 2010 | 1,305 | 1,396 | 1,579 | 1,566 | 1,442 | 1,422 | 1,419 | 1,343 | 1,473 | 1,509 | 1,317 | 1,392 |
| 2011 | 1,447 | 1,358 | 1,620 | 1,420 | 1,381 | 1,449 | 1,532 | 1,518 | 1,463 | 1,345 | 1,296 | 1,515 |
| 2012 | 1,299 | 1,161 | 1,317 | 1,248 | 1,418 | 1,467 | 1,496 | 1,527 | 1,413 | 1,562 | 1,431 | 1,330 |
| 2013 | 1,243 | 936 | 1,291 | 1,295 | 1,377 | 1,432 | 1,502 | 1,566 | 1,475 | 1,526 | 1,331 | 1,410 |
| 2014 | 1,548 | 1,349 | 1,513 | 1,441 | 1,666 | 1,594 | 1,702 | 1,708 | 1,596 | 1,532 | 1,474 | 1,662 |
| 2015 | 1,279 | 1,107 | 1,281 | 1,415 | 1,327 | 1,265 | 1,333 | 1,313 | 1,337 | 1,236 | 1,028 | 890 |
| 2016 | 1,366 | 1,169 | 1,340 | 1,462 | 1,438 | 1,402 | 1,476 | 1,579 | 1,435 | 1,465 | 1,365 | 1,389 |
| 2017 | 1,404 | 1,234 | 1,473 | 1,404 | 1,399 | 1,439 | 1,434 | 1,492 | 1,394 | 1,446 | 1,398 | 1,451 |
| 2018 | 1,489 | 1,222 | 1,476 | 1,345 | 1,283 | 1,467 | 1,614 | 1,497 | 1,469 | 1,358 | 1,159 | 1,216 |
| 2019 | 1,286 | 991 | 1,286 | 915 | 1,076 | 1,212 | 1,218 | 1,266 | 1,220 | 1,224 | 1,257 | 1,358 |
| 2020 | 1,207 | 1,099 | 1,156 | 991 | 903 | 987 | 1,090 | 1,089 | 1,134 | 1,029 | 917 | 1,019 |
| 2021 | 1,004 | 889 | 1,226 | 1,205 | 1,209 | 1,198 | 1,184 | 1,211 | 1,228 | 1,246 | 1,040 | 1,158 |
| 2022 | -- | -- | -- | -- | -- | -- | -- | -- | -- | -- | -- | -- |
| 2023 | -- | -- | -- | -- | -- | -- | -- | -- | -- | -- | -- | -- |
| 2024 | -- | |||||||||||
| - = No Data Reported; -- = Not Applicable; NA = Not Available; W = Withheld to avoid disclosure of individual company data. |
| Release Date: 3/29/2024 |
| Next Release Date: 4/30/2024 |