|
Download Data (XLS File) |
|
||||||||
|
||||||||
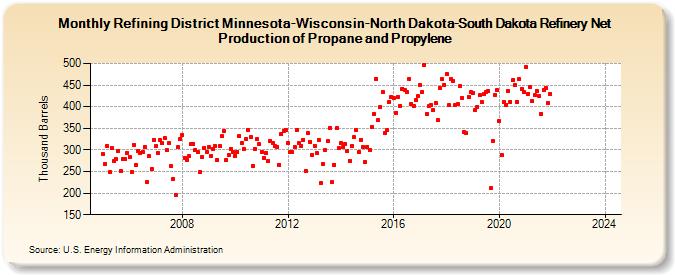
| Refining District Minnesota-Wisconsin-North Dakota-South Dakota Refinery Net Production of Propane and Propylene (Thousand Barrels) | ||||||||
| Year | Jan | Feb | Mar | Apr | May | Jun | Jul | Aug | Sep | Oct | Nov | Dec |
|---|---|---|---|---|---|---|---|---|---|---|---|---|
| 2005 | 290 | 267 | 309 | 248 | 304 | 274 | 278 | 298 | 251 | 280 | 280 | 293 |
| 2006 | 283 | 248 | 312 | 264 | 298 | 292 | 296 | 307 | 225 | 285 | 256 | 324 |
| 2007 | 308 | 293 | 322 | 315 | 328 | 299 | 316 | 262 | 233 | 196 | 306 | 326 |
| 2008 | 335 | 282 | 277 | 285 | 314 | 314 | 300 | 294 | 248 | 283 | 304 | 295 |
| 2009 | 306 | 286 | 302 | 308 | 277 | 309 | 332 | 344 | 277 | 288 | 303 | 296 |
| 2010 | 287 | 294 | 332 | 316 | 301 | 325 | 347 | 329 | 263 | 302 | 326 | 313 |
| 2011 | 296 | 282 | 293 | 274 | 321 | 316 | 309 | 307 | 266 | 336 | 344 | 347 |
| 2012 | 316 | 294 | 294 | 307 | 345 | 315 | 310 | 324 | 252 | 338 | 319 | 289 |
| 2013 | 310 | 292 | 323 | 223 | 268 | 299 | 320 | 351 | 225 | 266 | 350 | 304 |
| 2014 | 315 | 306 | 314 | 297 | 275 | 310 | 329 | 346 | 294 | 324 | 307 | 272 |
| 2015 | 307 | 300 | 353 | 384 | 465 | 369 | 400 | 433 | 339 | 346 | 411 | 422 |
| 2016 | 421 | 386 | 423 | 402 | 442 | 439 | 433 | 465 | 407 | 402 | 416 | 424 |
| 2017 | 450 | 434 | 496 | 383 | 401 | 404 | 392 | 408 | 369 | 444 | 464 | 451 |
| 2018 | 475 | 403 | 464 | 460 | 403 | 406 | 448 | 421 | 342 | 339 | 423 | 433 |
| 2019 | 432 | 393 | 399 | 426 | 411 | 429 | 434 | 436 | 211 | 321 | 428 | 438 |
| 2020 | 367 | 288 | 412 | 404 | 437 | 412 | 461 | 450 | 412 | 464 | 441 | 433 |
| 2021 | 492 | 430 | 446 | 413 | 426 | 437 | 425 | 384 | 439 | 444 | 408 | 430 |
| 2022 | -- | -- | -- | -- | -- | -- | -- | -- | -- | -- | -- | -- |
| 2023 | -- | -- | -- | -- | -- | -- | -- | -- | -- | -- | -- | -- |
| 2024 | -- | |||||||||||
| - = No Data Reported; -- = Not Applicable; NA = Not Available; W = Withheld to avoid disclosure of individual company data. |
| Release Date: 3/29/2024 |
| Next Release Date: 4/30/2024 |