|
Download Data (XLS File) |
|
||||||||
|
||||||||
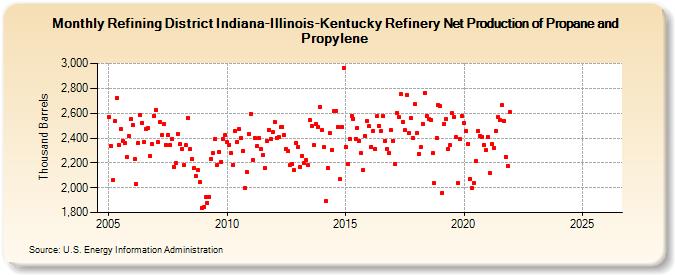
| Refining District Indiana-Illinois-Kentucky Refinery Net Production of Propane and Propylene (Thousand Barrels) | ||||||||
| Year | Jan | Feb | Mar | Apr | May | Jun | Jul | Aug | Sep | Oct | Nov | Dec |
|---|---|---|---|---|---|---|---|---|---|---|---|---|
| 2005 | 2,567 | 2,339 | 2,060 | 2,534 | 2,726 | 2,347 | 2,472 | 2,374 | 2,357 | 2,245 | 2,418 | 2,552 |
| 2006 | 2,506 | 2,231 | 2,027 | 2,363 | 2,585 | 2,521 | 2,370 | 2,474 | 2,477 | 2,255 | 2,350 | 2,580 |
| 2007 | 2,625 | 2,364 | 2,530 | 2,427 | 2,509 | 2,345 | 2,426 | 2,345 | 2,393 | 2,169 | 2,198 | 2,436 |
| 2008 | 2,351 | 2,315 | 2,183 | 2,341 | 2,564 | 2,308 | 2,229 | 2,157 | 2,095 | 2,139 | 2,045 | 1,840 |
| 2009 | 1,841 | 1,923 | 1,877 | 1,928 | 2,232 | 2,277 | 2,394 | 2,183 | 2,291 | 2,209 | 2,392 | 2,421 |
| 2010 | 2,365 | 2,346 | 2,277 | 2,185 | 2,453 | 2,369 | 2,474 | 2,401 | 2,295 | 1,999 | 2,123 | 2,434 |
| 2011 | 2,597 | 2,223 | 2,399 | 2,332 | 2,397 | 2,311 | 2,262 | 2,162 | 2,372 | 2,465 | 2,389 | 2,446 |
| 2012 | 2,531 | 2,403 | 2,407 | 2,488 | 2,489 | 2,424 | 2,308 | 2,293 | 2,181 | 2,189 | 2,139 | 2,358 |
| 2013 | 2,329 | 2,167 | 2,259 | 2,197 | 2,225 | 2,179 | 2,544 | 2,496 | 2,342 | 2,514 | 2,487 | 2,651 |
| 2014 | 2,462 | 2,327 | 1,890 | 2,159 | 2,438 | 2,302 | 2,614 | 2,621 | 2,487 | 2,067 | 2,491 | 2,964 |
| 2015 | 2,330 | 2,193 | 2,394 | 2,578 | 2,557 | 2,391 | 2,484 | 2,380 | 2,277 | 2,146 | 2,413 | 2,535 |
| 2016 | 2,493 | 2,330 | 2,460 | 2,311 | 2,577 | 2,498 | 2,458 | 2,576 | 2,379 | 2,311 | 2,281 | 2,461 |
| 2017 | 2,380 | 2,187 | 2,603 | 2,567 | 2,754 | 2,528 | 2,462 | 2,749 | 2,438 | 2,560 | 2,404 | 2,674 |
| 2018 | 2,438 | 2,275 | 2,324 | 2,513 | 2,764 | 2,579 | 2,556 | 2,546 | 2,276 | 2,036 | 2,402 | 2,665 |
| 2019 | 2,657 | 1,961 | 2,512 | 2,554 | 2,315 | 2,343 | 2,599 | 2,567 | 2,405 | 2,039 | 2,391 | 2,577 |
| 2020 | 2,522 | 2,456 | 2,354 | 2,072 | 1,995 | 2,039 | 2,217 | 2,459 | 2,415 | 2,412 | 2,342 | 2,300 |
| 2021 | 2,409 | 2,117 | 2,348 | 2,323 | 2,458 | 2,571 | 2,544 | 2,663 | 2,539 | 2,248 | 2,177 | 2,609 |
| 2022 | -- | -- | -- | -- | -- | -- | -- | -- | -- | -- | -- | -- |
| 2023 | -- | -- | -- | -- | -- | -- | -- | -- | -- | -- | -- | -- |
| 2024 | -- | |||||||||||
| - = No Data Reported; -- = Not Applicable; NA = Not Available; W = Withheld to avoid disclosure of individual company data. |
| Release Date: 3/29/2024 |
| Next Release Date: 4/30/2024 |