|
Download Data (XLS File) |
|
||||||||
|
||||||||
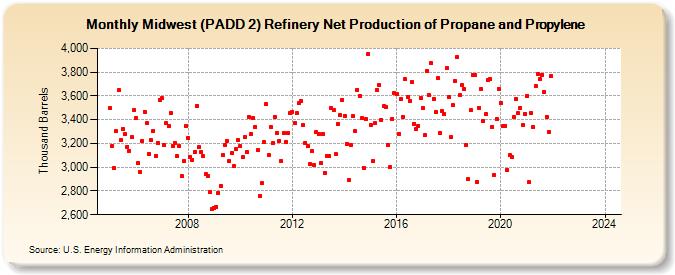
| Midwest (PADD 2) Refinery Net Production of Propane and Propylene (Thousand Barrels) | ||||||||
| Year | Jan | Feb | Mar | Apr | May | Jun | Jul | Aug | Sep | Oct | Nov | Dec |
|---|---|---|---|---|---|---|---|---|---|---|---|---|
| 2005 | 3,495 | 3,179 | 2,990 | 3,301 | 3,646 | 3,225 | 3,323 | 3,277 | 3,173 | 3,135 | 3,253 | 3,480 |
| 2006 | 3,412 | 3,033 | 2,957 | 3,222 | 3,467 | 3,370 | 3,111 | 3,225 | 3,307 | 3,095 | 3,204 | 3,568 |
| 2007 | 3,579 | 3,184 | 3,369 | 3,346 | 3,452 | 3,180 | 3,202 | 3,091 | 3,179 | 2,925 | 3,048 | 3,344 |
| 2008 | 3,248 | 3,084 | 3,063 | 3,129 | 3,519 | 3,167 | 3,127 | 3,092 | 2,940 | 2,924 | 2,790 | 2,645 |
| 2009 | 2,653 | 2,667 | 2,783 | 2,843 | 3,101 | 3,187 | 3,222 | 3,049 | 3,119 | 3,007 | 3,150 | 3,233 |
| 2010 | 3,175 | 3,083 | 3,250 | 3,128 | 3,423 | 3,282 | 3,417 | 3,339 | 3,143 | 2,760 | 2,864 | 3,209 |
| 2011 | 3,529 | 3,104 | 3,339 | 3,202 | 3,422 | 3,290 | 3,224 | 3,052 | 3,289 | 3,215 | 3,292 | 3,456 |
| 2012 | 3,468 | 3,374 | 3,454 | 3,537 | 3,560 | 3,352 | 3,207 | 3,176 | 3,026 | 3,134 | 3,020 | 3,297 |
| 2013 | 3,279 | 3,035 | 3,283 | 2,954 | 3,096 | 3,093 | 3,500 | 3,484 | 3,111 | 3,362 | 3,436 | 3,569 |
| 2014 | 3,435 | 3,198 | 2,895 | 3,190 | 3,427 | 3,303 | 3,653 | 3,600 | 3,413 | 2,996 | 3,405 | 3,954 |
| 2015 | 3,355 | 3,052 | 3,369 | 3,651 | 3,691 | 3,398 | 3,511 | 3,510 | 3,188 | 2,999 | 3,406 | 3,623 |
| 2016 | 3,618 | 3,282 | 3,572 | 3,425 | 3,739 | 3,593 | 3,558 | 3,714 | 3,367 | 3,325 | 3,348 | 3,585 |
| 2017 | 3,497 | 3,267 | 3,809 | 3,604 | 3,877 | 3,574 | 3,464 | 3,749 | 3,284 | 3,471 | 3,446 | 3,831 |
| 2018 | 3,590 | 3,253 | 3,520 | 3,726 | 3,924 | 3,604 | 3,691 | 3,658 | 3,188 | 2,898 | 3,479 | 3,779 |
| 2019 | 3,777 | 2,878 | 3,501 | 3,658 | 3,390 | 3,444 | 3,733 | 3,739 | 3,342 | 2,934 | 3,407 | 3,660 |
| 2020 | 3,541 | 3,348 | 3,349 | 2,977 | 3,102 | 3,088 | 3,423 | 3,575 | 3,452 | 3,498 | 3,357 | 3,451 |
| 2021 | 3,603 | 2,873 | 3,453 | 3,339 | 3,682 | 3,788 | 3,739 | 3,780 | 3,634 | 3,422 | 3,300 | 3,767 |
| 2022 | -- | -- | -- | -- | -- | -- | -- | -- | -- | -- | -- | -- |
| 2023 | -- | -- | -- | -- | -- | -- | -- | -- | -- | -- | -- | -- |
| 2024 | -- | |||||||||||
| - = No Data Reported; -- = Not Applicable; NA = Not Available; W = Withheld to avoid disclosure of individual company data. |
| Release Date: 3/29/2024 |
| Next Release Date: 4/30/2024 |