|
Download Data (XLS File) |
|
||||||||
|
||||||||
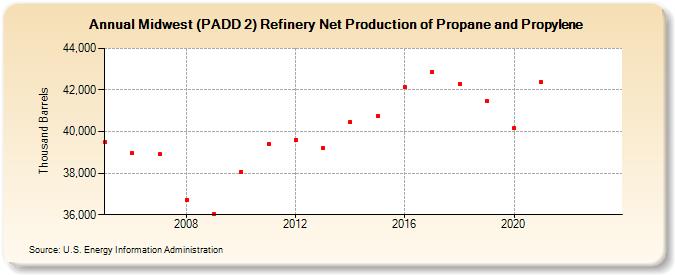
| Midwest (PADD 2) Refinery Net Production of Propane and Propylene (Thousand Barrels) | ||||||||
| Decade | Year-0 | Year-1 | Year-2 | Year-3 | Year-4 | Year-5 | Year-6 | Year-7 | Year-8 | Year-9 |
|---|---|---|---|---|---|---|---|---|---|---|
| 2000's | 39,477 | 38,971 | 38,899 | 36,728 | 36,014 | |||||
| 2010's | 38,073 | 39,414 | 39,605 | 39,202 | 40,469 | 40,753 | 42,126 | 42,873 | 42,310 | 41,463 |
| 2020's | 40,161 | 42,380 | -- | -- |
| - = No Data Reported; -- = Not Applicable; NA = Not Available; W = Withheld to avoid disclosure of individual company data. |
| Release Date: 8/30/2024 |
| Next Release Date: 8/29/2025 |