|
Download Data (XLS File) |
|
||||||||
|
||||||||
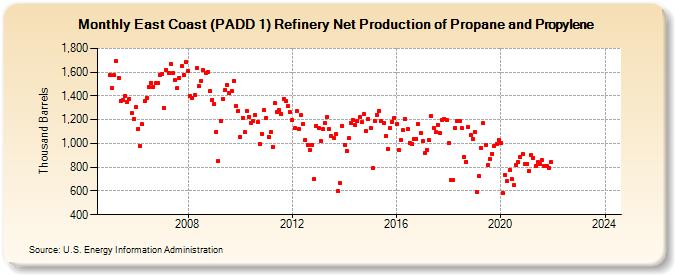
| East Coast (PADD 1) Refinery Net Production of Propane and Propylene (Thousand Barrels) | ||||||||
| Year | Jan | Feb | Mar | Apr | May | Jun | Jul | Aug | Sep | Oct | Nov | Dec |
|---|---|---|---|---|---|---|---|---|---|---|---|---|
| 2005 | 1,574 | 1,464 | 1,575 | 1,691 | 1,553 | 1,361 | 1,365 | 1,401 | 1,350 | 1,377 | 1,255 | 1,206 |
| 2006 | 1,304 | 1,124 | 979 | 1,161 | 1,357 | 1,382 | 1,472 | 1,512 | 1,477 | 1,510 | 1,510 | 1,576 |
| 2007 | 1,587 | 1,300 | 1,621 | 1,595 | 1,669 | 1,592 | 1,531 | 1,466 | 1,554 | 1,651 | 1,579 | 1,684 |
| 2008 | 1,611 | 1,399 | 1,386 | 1,404 | 1,635 | 1,482 | 1,529 | 1,620 | 1,596 | 1,598 | 1,439 | 1,366 |
| 2009 | 1,331 | 1,100 | 854 | 1,186 | 1,376 | 1,447 | 1,494 | 1,422 | 1,445 | 1,526 | 1,312 | 1,273 |
| 2010 | 1,057 | 1,215 | 1,095 | 1,274 | 1,226 | 1,170 | 1,185 | 1,236 | 1,181 | 997 | 1,082 | 1,281 |
| 2011 | 1,218 | 1,058 | 1,094 | 974 | 1,337 | 1,264 | 1,283 | 1,248 | 1,375 | 1,354 | 1,315 | 1,262 |
| 2012 | 1,195 | 1,127 | 1,270 | 1,123 | 1,238 | 1,167 | 1,029 | 986 | 947 | 989 | 701 | 1,150 |
| 2013 | 1,133 | 1,018 | 1,118 | 1,173 | 1,225 | 1,124 | 1,061 | 1,048 | 1,078 | 596 | 664 | 1,150 |
| 2014 | 989 | 940 | 1,042 | 1,171 | 1,198 | 1,155 | 1,186 | 1,219 | 1,177 | 1,247 | 1,104 | 1,205 |
| 2015 | 1,134 | 791 | 1,193 | 1,242 | 1,276 | 1,188 | 1,168 | 1,061 | 954 | 1,130 | 1,184 | 1,217 |
| 2016 | 1,160 | 945 | 1,033 | 1,109 | 1,205 | 1,118 | 1,007 | 998 | 1,040 | 1,040 | 1,167 | 1,087 |
| 2017 | 1,018 | 918 | 947 | 1,026 | 1,230 | 1,133 | 1,093 | 1,158 | 1,091 | 1,194 | 1,208 | 1,197 |
| 2018 | 1,002 | 689 | 694 | 1,134 | 1,186 | 1,193 | 1,128 | 886 | 847 | 1,140 | 1,070 | 1,039 |
| 2019 | 1,096 | 593 | 724 | 964 | 1,169 | 985 | 816 | 871 | 915 | 982 | 994 | 1,031 |
| 2020 | 1,002 | 579 | 738 | 687 | 778 | 697 | 648 | 817 | 840 | 886 | 912 | 827 |
| 2021 | 828 | 770 | 899 | 879 | 811 | 843 | 826 | 857 | 813 | 810 | 793 | 843 |
| 2022 | -- | -- | -- | -- | -- | -- | -- | -- | -- | -- | -- | -- |
| 2023 | -- | -- | -- | -- | -- | -- | -- | -- | -- | -- | -- | -- |
| 2024 | -- | |||||||||||
| - = No Data Reported; -- = Not Applicable; NA = Not Available; W = Withheld to avoid disclosure of individual company data. |
| Release Date: 3/29/2024 |
| Next Release Date: 4/30/2024 |