|
Download Data (XLS File) |
|
||||||||
|
||||||||
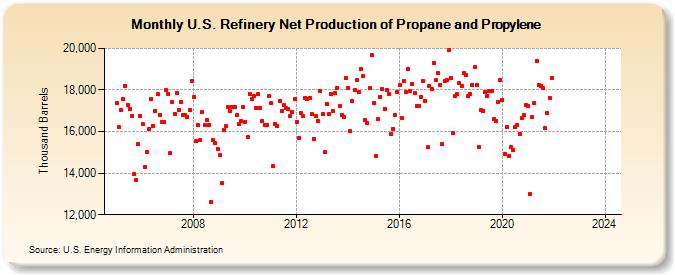
| U.S. Refinery Net Production of Propane and Propylene (Thousand Barrels) | ||||||||
| Year | Jan | Feb | Mar | Apr | May | Jun | Jul | Aug | Sep | Oct | Nov | Dec |
|---|---|---|---|---|---|---|---|---|---|---|---|---|
| 2005 | 17,360 | 16,199 | 17,017 | 17,576 | 18,186 | 17,281 | 17,103 | 16,728 | 13,968 | 13,668 | 15,403 | 16,767 |
| 2006 | 16,369 | 14,284 | 15,036 | 16,108 | 17,582 | 16,287 | 17,004 | 17,792 | 16,795 | 16,467 | 16,456 | 18,010 |
| 2007 | 17,824 | 14,950 | 17,438 | 16,864 | 17,866 | 17,043 | 17,423 | 16,789 | 16,804 | 16,700 | 17,027 | 18,451 |
| 2008 | 17,642 | 15,525 | 16,314 | 15,597 | 16,920 | 16,326 | 16,559 | 16,318 | 12,604 | 15,607 | 15,447 | 15,161 |
| 2009 | 14,851 | 13,522 | 16,098 | 16,266 | 17,162 | 16,993 | 17,173 | 17,169 | 16,774 | 16,340 | 16,500 | 17,163 |
| 2010 | 16,474 | 15,732 | 17,827 | 17,545 | 17,708 | 17,150 | 17,798 | 17,124 | 16,530 | 16,305 | 16,304 | 17,726 |
| 2011 | 17,379 | 14,329 | 16,373 | 16,263 | 17,461 | 17,009 | 17,282 | 17,130 | 17,069 | 16,726 | 16,918 | 17,553 |
| 2012 | 16,464 | 15,709 | 16,882 | 16,741 | 17,623 | 17,562 | 17,626 | 16,841 | 15,662 | 16,758 | 16,504 | 17,937 |
| 2013 | 16,823 | 15,006 | 17,339 | 16,842 | 17,797 | 16,967 | 17,839 | 18,092 | 17,213 | 16,810 | 16,717 | 18,593 |
| 2014 | 18,102 | 16,022 | 17,492 | 18,009 | 18,483 | 17,880 | 18,989 | 18,659 | 16,553 | 16,394 | 18,103 | 19,692 |
| 2015 | 17,393 | 14,814 | 16,601 | 17,679 | 18,039 | 17,081 | 17,990 | 17,795 | 15,871 | 16,124 | 16,777 | 17,905 |
| 2016 | 18,246 | 16,639 | 18,450 | 17,923 | 18,996 | 17,953 | 18,278 | 17,843 | 17,244 | 17,248 | 17,679 | 18,442 |
| 2017 | 17,482 | 15,236 | 18,180 | 18,028 | 19,285 | 18,457 | 18,810 | 18,247 | 15,400 | 18,419 | 18,477 | 19,905 |
| 2018 | 18,599 | 15,915 | 17,702 | 17,783 | 18,328 | 18,213 | 18,802 | 18,711 | 17,704 | 17,787 | 18,248 | 19,087 |
| 2019 | 18,258 | 15,270 | 17,022 | 17,002 | 17,900 | 17,717 | 17,943 | 17,951 | 16,603 | 16,513 | 17,432 | 18,477 |
| 2020 | 17,535 | 14,916 | 16,242 | 14,829 | 15,250 | 15,126 | 16,195 | 16,329 | 15,889 | 16,672 | 16,791 | 17,296 |
| 2021 | 17,212 | 12,990 | 16,685 | 17,376 | 19,378 | 18,236 | 18,206 | 18,105 | 16,154 | 16,910 | 17,625 | 18,573 |
| 2022 | -- | -- | -- | -- | -- | -- | -- | -- | -- | -- | -- | -- |
| 2023 | -- | -- | -- | -- | -- | -- | -- | -- | -- | -- | -- | -- |
| 2024 | -- | -- | -- | -- | -- | -- | ||||||
| - = No Data Reported; -- = Not Applicable; NA = Not Available; W = Withheld to avoid disclosure of individual company data. |
| Release Date: 8/30/2024 |
| Next Release Date: 9/30/2024 |
Referring Pages: