|
Download Data (XLS File) |
|
||||||||
|
||||||||
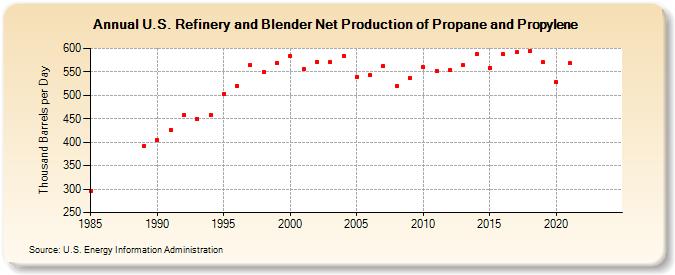
| U.S. Refinery and Blender Net Production of Propane and Propylene (Thousand Barrels per Day) | ||||||||
| Decade | Year-0 | Year-1 | Year-2 | Year-3 | Year-4 | Year-5 | Year-6 | Year-7 | Year-8 | Year-9 |
|---|---|---|---|---|---|---|---|---|---|---|
| 1980's | 295 | 392 | ||||||||
| 1990's | 404 | 427 | 458 | 450 | 459 | 503 | 520 | 565 | 550 | 569 |
| 2000's | 583 | 556 | 572 | 570 | 584 | 540 | 543 | 562 | 519 | 537 |
| 2010's | 560 | 552 | 553 | 564 | 587 | 559 | 587 | 592 | 594 | 570 |
| 2020's | 528 | 568 | -- | -- |
| - = No Data Reported; -- = Not Applicable; NA = Not Available; W = Withheld to avoid disclosure of individual company data. |
| Release Date: 3/29/2024 |
| Next Release Date: 8/30/2024 |