|
Download Data (XLS File) |
|
||||||||
|
||||||||
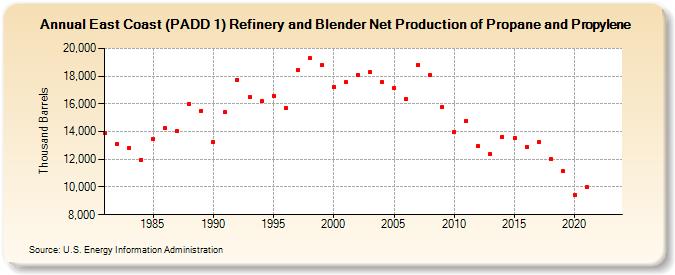
| East Coast (PADD 1) Refinery and Blender Net Production of Propane and Propylene (Thousand Barrels) | ||||||||
| Decade | Year-0 | Year-1 | Year-2 | Year-3 | Year-4 | Year-5 | Year-6 | Year-7 | Year-8 | Year-9 |
|---|---|---|---|---|---|---|---|---|---|---|
| 1980's | 13,874 | 13,069 | 12,827 | 11,973 | 13,431 | 14,240 | 14,017 | 15,982 | 15,514 | |
| 1990's | 13,259 | 15,387 | 17,741 | 16,503 | 16,171 | 16,598 | 15,728 | 18,444 | 19,271 | 18,799 |
| 2000's | 17,215 | 17,544 | 18,096 | 18,288 | 17,570 | 17,172 | 16,364 | 18,829 | 18,065 | 15,766 |
| 2010's | 13,999 | 14,782 | 12,922 | 12,388 | 13,633 | 13,538 | 12,909 | 13,213 | 12,008 | 11,140 |
| 2020's | 9,411 | 9,972 | -- | -- |
| - = No Data Reported; -- = Not Applicable; NA = Not Available; W = Withheld to avoid disclosure of individual company data. |
| Release Date: 3/29/2024 |
| Next Release Date: 8/30/2024 |