|
Download Data (XLS File) |
|
||||||||
|
||||||||
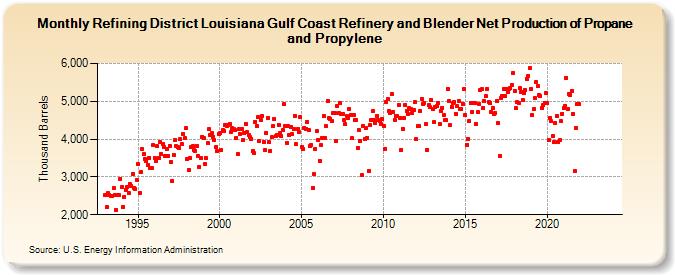
| Refining District Louisiana Gulf Coast Refinery and Blender Net Production of Propane and Propylene (Thousand Barrels) | ||||||||
| Year | Jan | Feb | Mar | Apr | May | Jun | Jul | Aug | Sep | Oct | Nov | Dec |
|---|---|---|---|---|---|---|---|---|---|---|---|---|
| 1993 | 2,513 | 2,196 | 2,564 | 2,533 | 2,507 | 2,500 | 2,695 | 2,533 | 2,128 | 2,515 | 2,510 | 2,954 |
| 1994 | 2,736 | 2,213 | 2,478 | 2,655 | 2,721 | 2,563 | 2,821 | 2,754 | 3,081 | 2,714 | 2,676 | 2,920 |
| 1995 | 3,329 | 2,580 | 3,141 | 3,743 | 3,605 | 3,483 | 3,428 | 3,326 | 3,510 | 3,230 | 3,223 | 3,840 |
| 1996 | 3,502 | 3,421 | 3,809 | 3,497 | 3,933 | 3,595 | 3,880 | 3,797 | 3,555 | 3,747 | 3,563 | 3,825 |
| 1997 | 3,394 | 2,896 | 3,592 | 3,963 | 3,807 | 3,803 | 3,755 | 3,992 | 3,865 | 4,141 | 4,021 | 4,286 |
| 1998 | 3,478 | 3,185 | 3,511 | 3,778 | 3,811 | 3,716 | 3,687 | 3,823 | 3,553 | 3,267 | 3,510 | 4,066 |
| 1999 | 4,040 | 3,340 | 3,490 | 3,887 | 4,259 | 4,104 | 4,150 | 4,065 | 3,971 | 3,798 | 3,678 | 4,137 |
| 2000 | 4,150 | 3,715 | 4,233 | 4,205 | 4,381 | 4,343 | 4,372 | 4,397 | 4,181 | 4,283 | 4,268 | 4,232 |
| 2001 | 4,042 | 3,607 | 4,259 | 4,131 | 4,265 | 3,976 | 4,165 | 4,407 | 4,186 | 4,117 | 4,046 | 4,004 |
| 2002 | 3,680 | 3,620 | 4,463 | 4,351 | 4,574 | 3,942 | 4,505 | 4,622 | 3,928 | 3,709 | 4,173 | 4,556 |
| 2003 | 3,912 | 3,680 | 4,045 | 4,344 | 4,537 | 4,077 | 4,108 | 4,386 | 4,151 | 4,069 | 4,234 | 4,917 |
| 2004 | 4,344 | 3,908 | 4,336 | 4,101 | 4,332 | 4,123 | 4,274 | 4,624 | 3,868 | 4,261 | 4,192 | 4,574 |
| 2005 | 3,796 | 3,737 | 4,297 | 4,275 | 4,459 | 4,237 | 3,808 | 3,849 | 2,713 | 3,070 | 3,741 | 4,214 |
| 2006 | 3,983 | 3,431 | 3,831 | 4,040 | 4,612 | 4,032 | 4,338 | 5,018 | 4,557 | 4,543 | 4,467 | 4,698 |
| 2007 | 4,680 | 3,937 | 4,877 | 4,690 | 4,942 | 4,673 | 4,660 | 4,495 | 4,391 | 4,601 | 4,560 | 4,799 |
| 2008 | 4,634 | 4,019 | 4,647 | 4,496 | 4,502 | 3,777 | 4,239 | 3,945 | 3,048 | 4,351 | 4,004 | 4,305 |
| 2009 | 4,040 | 3,161 | 4,365 | 4,507 | 4,730 | 4,494 | 4,431 | 4,620 | 4,511 | 4,472 | 4,400 | 4,527 |
| 2010 | 4,341 | 3,749 | 4,975 | 5,058 | 4,752 | 4,698 | 5,192 | 4,720 | 4,503 | 4,619 | 4,604 | 4,905 |
| 2011 | 4,566 | 3,720 | 4,275 | 4,559 | 4,910 | 4,736 | 4,659 | 4,811 | 4,784 | 4,696 | 4,763 | 4,980 |
| 2012 | 3,991 | 4,344 | 4,346 | 4,748 | 5,067 | 4,932 | 4,958 | 4,388 | 3,722 | 4,891 | 4,842 | 5,038 |
| 2013 | 4,788 | 4,446 | 4,857 | 4,878 | 4,966 | 4,395 | 4,754 | 4,830 | 4,645 | 4,492 | 4,496 | 5,337 |
| 2014 | 4,995 | 4,361 | 4,850 | 4,946 | 4,983 | 4,677 | 4,873 | 5,012 | 4,799 | 4,796 | 4,937 | 5,333 |
| 2015 | 4,625 | 3,854 | 4,014 | 4,479 | 4,954 | 4,721 | 4,948 | 4,958 | 4,395 | 4,706 | 4,933 | 5,294 |
| 2016 | 5,316 | 4,833 | 5,010 | 5,137 | 5,330 | 4,982 | 4,946 | 4,724 | 4,816 | 4,651 | 4,696 | 5,011 |
| 2017 | 4,428 | 3,543 | 5,081 | 5,147 | 5,326 | 5,137 | 5,317 | 5,240 | 5,313 | 5,341 | 5,427 | 5,751 |
| 2018 | 5,275 | 4,811 | 4,979 | 4,960 | 5,340 | 5,246 | 5,028 | 5,217 | 5,298 | 5,602 | 5,671 | 5,873 |
| 2019 | 5,330 | 4,643 | 4,792 | 5,081 | 5,512 | 5,392 | 5,165 | 5,134 | 4,817 | 4,890 | 4,964 | 5,230 |
| 2020 | 4,961 | 3,969 | 4,549 | 4,472 | 4,084 | 3,913 | 4,437 | 4,612 | 3,930 | 3,964 | 4,466 | 4,673 |
| 2021 | 4,817 | 4,884 | 5,626 | 4,793 | 5,204 | 5,174 | 5,281 | 4,674 | 3,145 | 4,296 | 4,923 | 4,939 |
| 2022 | -- | -- | -- | -- | -- | -- | -- | -- | -- | -- | -- | -- |
| 2023 | -- | -- | -- | -- | -- | -- | -- | -- | -- | -- | -- | -- |
| 2024 | -- | |||||||||||
| - = No Data Reported; -- = Not Applicable; NA = Not Available; W = Withheld to avoid disclosure of individual company data. |
| Release Date: 3/29/2024 |
| Next Release Date: 4/30/2024 |