|
Download Data (XLS File) |
|
||||||||
|
||||||||
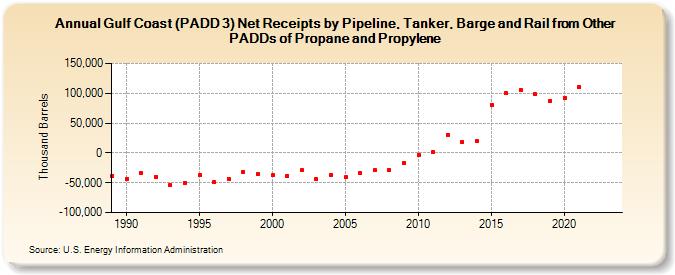
| Gulf Coast (PADD 3) Net Receipts by Pipeline, Tanker, Barge and Rail from Other PADDs of Propane and Propylene (Thousand Barrels) | ||||||||
| Decade | Year-0 | Year-1 | Year-2 | Year-3 | Year-4 | Year-5 | Year-6 | Year-7 | Year-8 | Year-9 |
|---|---|---|---|---|---|---|---|---|---|---|
| 1980's | -38,878 | |||||||||
| 1990's | -43,303 | -33,628 | -39,569 | -53,796 | -49,919 | -37,081 | -49,304 | -43,655 | -32,244 | -34,933 |
| 2000's | -37,673 | -37,934 | -29,296 | -44,330 | -36,439 | -40,795 | -34,333 | -29,386 | -28,965 | -16,410 |
| 2010's | -2,743 | 1,070 | 30,683 | 18,573 | 19,824 | 81,196 | 99,897 | 105,901 | 98,266 | 87,180 |
| 2020's | 92,728 | 110,519 | -- | -- |
| - = No Data Reported; -- = Not Applicable; NA = Not Available; W = Withheld to avoid disclosure of individual company data. |
| Release Date: 3/29/2024 |
| Next Release Date: 8/30/2024 |