|
Download Data (XLS File) |
|
||||||||
|
||||||||
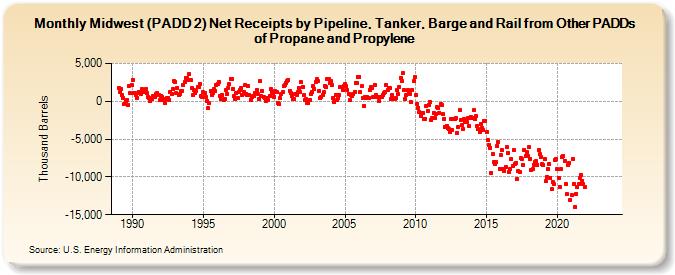
| Midwest (PADD 2) Net Receipts by Pipeline, Tanker, Barge and Rail from Other PADDs of Propane and Propylene (Thousand Barrels) | ||||||||
| Year | Jan | Feb | Mar | Apr | May | Jun | Jul | Aug | Sep | Oct | Nov | Dec |
|---|---|---|---|---|---|---|---|---|---|---|---|---|
| 1989 | 1,743 | 1,190 | 1,645 | 831 | 457 | -311 | 80 | 205 | -472 | 2,022 | 1,060 | 2,162 |
| 1990 | 2,841 | 1,108 | 1,109 | 801 | 493 | 1,272 | 1,086 | 986 | 1,563 | 1,193 | 1,549 | 1,599 |
| 1991 | 1,077 | 585 | 464 | 11 | 346 | 671 | 750 | 518 | 962 | 1,036 | 796 | 159 |
| 1992 | 729 | 577 | 179 | -162 | 332 | 461 | 495 | 217 | 1,283 | 986 | 1,562 | 2,648 |
| 1993 | 2,581 | 1,056 | 1,796 | 830 | 910 | 1,407 | 1,406 | 2,115 | 2,518 | 3,117 | 3,105 | 2,771 |
| 1994 | 3,588 | 2,820 | 1,713 | 797 | 1,446 | 1,113 | 1,375 | 1,863 | 1,924 | 2,341 | 692 | 537 |
| 1995 | 1,166 | 1,075 | 629 | 23 | -918 | -262 | 1,355 | 858 | 1,139 | 1,611 | 1,375 | 2,155 |
| 1996 | 2,343 | 2,528 | 673 | 298 | 829 | 137 | 327 | 1,538 | 1,024 | 1,767 | 2,242 | 2,989 |
| 1997 | 3,005 | 1,646 | 747 | 264 | 1,066 | 460 | 1,265 | 1,522 | 1,802 | 831 | 1,283 | 2,100 |
| 1998 | 968 | 885 | 2,006 | 858 | 213 | 599 | 702 | 688 | 1,109 | 1,504 | 993 | 332 |
| 1999 | 2,703 | 686 | 1,351 | 519 | 461 | 61 | 471 | 123 | 718 | 1,622 | 1,287 | 1,054 |
| 2000 | 633 | 1,311 | 1,187 | -254 | -368 | 410 | 1,008 | 1,178 | 1,974 | 2,167 | 2,415 | 2,661 |
| 2001 | 2,824 | 1,411 | 1,097 | 692 | 336 | 272 | 973 | 880 | 1,221 | 1,793 | 1,292 | 2,509 |
| 2002 | 1,909 | 770 | 160 | 253 | -203 | -228 | 222 | 933 | 1,193 | 2,020 | 1,685 | 2,560 |
| 2003 | 2,894 | 2,637 | 1,420 | 371 | 579 | 896 | 1,182 | 2,071 | 1,891 | 2,955 | 2,937 | 2,421 |
| 2004 | 2,630 | 2,095 | 427 | -144 | 819 | 164 | 370 | 832 | 1,853 | 1,955 | 1,428 | 2,052 |
| 2005 | 2,297 | 1,962 | 1,523 | 1,008 | 111 | 807 | 737 | 998 | 1,236 | 2,464 | 2,479 | 3,271 |
| 2006 | 3,263 | 1,202 | 1,965 | 459 | -592 | 588 | 449 | 539 | 442 | 1,538 | 1,914 | 1,802 |
| 2007 | 574 | 2,163 | 812 | 522 | 622 | 78 | 522 | 521 | 808 | 1,063 | 1,284 | 2,182 |
| 2008 | 1,473 | 1,695 | 1,736 | 310 | 780 | 361 | 248 | 457 | 1,513 | 965 | 1,946 | 3,088 |
| 2009 | 2,695 | 3,695 | 1,504 | 349 | 857 | 1,432 | 1,215 | 937 | -156 | 1,485 | 2,626 | 3,198 |
| 2010 | 828 | -421 | -880 | -1,441 | -1,892 | -1,572 | -1,503 | -2,298 | -2,283 | -662 | -1,271 | -460 |
| 2011 | -133 | -2,538 | -2,273 | -1,492 | -2,273 | -1,646 | -819 | -836 | -1,501 | -371 | -456 | -1,694 |
| 2012 | -2,289 | -3,335 | -3,204 | -3,533 | -3,721 | -4,106 | -2,381 | -3,770 | -2,370 | -2,318 | -2,187 | -4,141 |
| 2013 | -3,392 | -1,187 | -2,488 | -3,104 | -3,632 | -2,389 | -2,744 | -2,758 | -2,189 | -3,280 | -2,197 | -2,082 |
| 2014 | -2,232 | -1,200 | -2,352 | -1,958 | -3,245 | -3,669 | -4,099 | -3,043 | -3,477 | -3,737 | -2,568 | -2,559 |
| 2015 | -4,062 | -5,149 | -5,776 | -6,131 | -9,438 | -7,003 | -8,037 | -8,340 | -8,087 | -5,916 | -5,445 | -8,921 |
| 2016 | -7,048 | -6,482 | -8,946 | -9,234 | -8,667 | -6,076 | -6,798 | -9,324 | -8,962 | -7,613 | -8,508 | -6,443 |
| 2017 | -8,255 | -8,118 | -10,238 | -9,236 | -9,413 | -7,545 | -7,635 | -8,393 | -6,440 | -7,191 | -6,684 | -7,264 |
| 2018 | -6,091 | -7,613 | -9,070 | -8,984 | -8,384 | -8,034 | -7,961 | -8,386 | -6,502 | -7,028 | -7,377 | -8,325 |
| 2019 | -8,435 | -7,642 | -10,604 | -9,975 | -8,975 | -8,250 | -10,100 | -11,643 | -10,668 | -10,963 | -7,813 | -7,601 |
| 2020 | -9,013 | -10,086 | -11,290 | -8,971 | -7,393 | -7,240 | -7,839 | -10,934 | -12,313 | -8,378 | -8,196 | -13,076 |
| 2021 | -12,363 | -7,570 | -10,880 | -13,967 | -12,196 | -11,394 | -10,921 | -10,135 | -9,752 | -10,479 | -11,003 | -11,320 |
| 2022 | -- | -- | -- | -- | -- | -- | -- | -- | -- | -- | -- | -- |
| 2023 | -- | -- | -- | -- | -- | -- | -- | -- | -- | -- | -- | -- |
| 2024 | -- | -- | -- | -- | -- | -- | ||||||
| - = No Data Reported; -- = Not Applicable; NA = Not Available; W = Withheld to avoid disclosure of individual company data. |
| Release Date: 8/30/2024 |
| Next Release Date: 9/30/2024 |