|
Download Data (XLS File) |
|
||||||||
|
||||||||
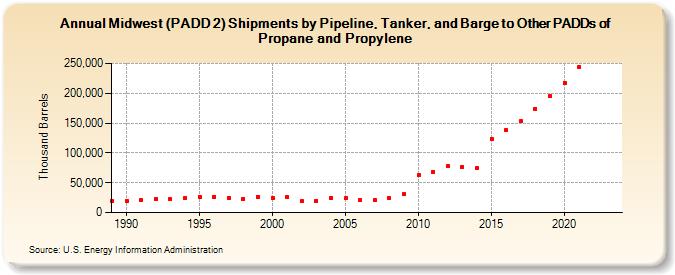
| Midwest (PADD 2) Shipments by Pipeline, Tanker, and Barge to Other PADDs of Propane and Propylene (Thousand Barrels) | ||||||||
| Decade | Year-0 | Year-1 | Year-2 | Year-3 | Year-4 | Year-5 | Year-6 | Year-7 | Year-8 | Year-9 |
|---|---|---|---|---|---|---|---|---|---|---|
| 1980's | 19,510 | |||||||||
| 1990's | 19,911 | 20,435 | 22,737 | 22,155 | 24,767 | 26,811 | 26,594 | 24,682 | 23,412 | 26,908 |
| 2000's | 25,194 | 25,862 | 18,660 | 19,939 | 24,717 | 23,772 | 20,603 | 20,881 | 23,714 | 30,600 |
| 2010's | 62,353 | 68,156 | 77,494 | 76,313 | 74,194 | 123,801 | 138,628 | 153,044 | 174,310 | 195,861 |
| 2020's | 217,740 | 244,806 | -- | -- |
| - = No Data Reported; -- = Not Applicable; NA = Not Available; W = Withheld to avoid disclosure of individual company data. |
| Release Date: 3/29/2024 |
| Next Release Date: 8/30/2024 |