|
Download Data (XLS File) |
|
||||||||
|
||||||||
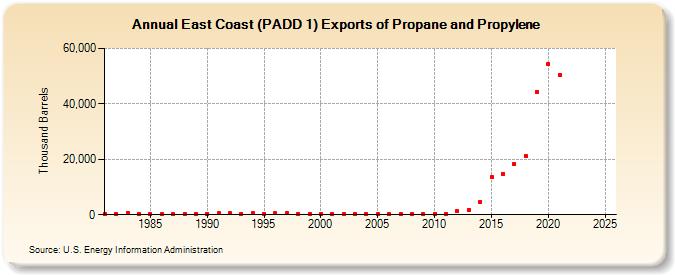
| East Coast (PADD 1) Exports of Propane and Propylene (Thousand Barrels) | ||||||||
| Decade | Year-0 | Year-1 | Year-2 | Year-3 | Year-4 | Year-5 | Year-6 | Year-7 | Year-8 | Year-9 |
|---|---|---|---|---|---|---|---|---|---|---|
| 1980's | 384 | 273 | 751 | 222 | 319 | 186 | 191 | 371 | 349 | |
| 1990's | 355 | 484 | 517 | 363 | 580 | 437 | 452 | 447 | 402 | 408 |
| 2000's | 414 | 344 | 216 | 288 | 248 | 206 | 203 | 320 | 275 | 248 |
| 2010's | 294 | 401 | 1,230 | 1,817 | 4,747 | 13,517 | 14,861 | 18,419 | 21,164 | 44,439 |
| 2020's | 54,335 | 50,339 | -- | -- |
| - = No Data Reported; -- = Not Applicable; NA = Not Available; W = Withheld to avoid disclosure of individual company data. |
| Release Date: 3/29/2024 |
| Next Release Date: 8/30/2024 |