|
Download Data (XLS File) |
|
||||||||
|
||||||||
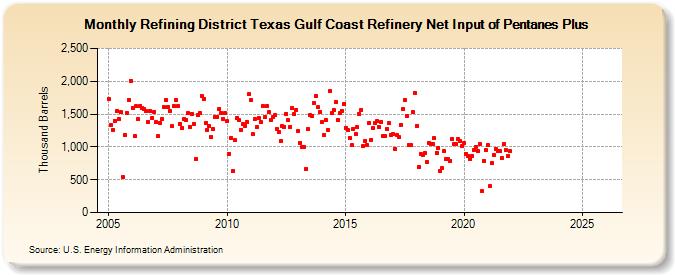
| Refining District Texas Gulf Coast Refinery Net Input of Pentanes Plus (Thousand Barrels) | ||||||||
| Year | Jan | Feb | Mar | Apr | May | Jun | Jul | Aug | Sep | Oct | Nov | Dec |
|---|---|---|---|---|---|---|---|---|---|---|---|---|
| 2005 | 1,726 | 1,339 | 1,259 | 1,398 | 1,545 | 1,423 | 1,527 | 543 | 1,183 | 1,514 | 1,716 | 2,010 |
| 2006 | 1,597 | 1,161 | 1,618 | 1,418 | 1,629 | 1,595 | 1,573 | 1,548 | 1,381 | 1,542 | 1,441 | 1,536 |
| 2007 | 1,377 | 1,163 | 1,364 | 1,425 | 1,602 | 1,713 | 1,606 | 1,546 | 1,311 | 1,618 | 1,714 | 1,617 |
| 2008 | 1,354 | 1,290 | 1,419 | 1,408 | 1,509 | 1,305 | 1,505 | 1,356 | 819 | 1,485 | 1,517 | 1,780 |
| 2009 | 1,734 | 1,364 | 1,258 | 1,311 | 1,147 | 1,267 | 1,457 | 1,461 | 1,581 | 1,522 | 1,429 | 1,514 |
| 2010 | 1,387 | 896 | 1,136 | 632 | 1,102 | 1,444 | 1,405 | 1,262 | 1,343 | 1,322 | 1,382 | 1,805 |
| 2011 | 1,713 | 1,195 | 1,423 | 1,305 | 1,446 | 1,380 | 1,618 | 1,451 | 1,623 | 1,527 | 1,404 | 1,448 |
| 2012 | 1,481 | 1,276 | 1,225 | 1,085 | 1,315 | 1,305 | 1,507 | 1,405 | 1,307 | 1,589 | 1,499 | 1,566 |
| 2013 | 1,245 | 1,065 | 991 | 994 | 670 | 1,272 | 1,480 | 1,476 | 1,669 | 1,777 | 1,600 | 1,533 |
| 2014 | 1,379 | 1,188 | 1,415 | 1,259 | 1,851 | 1,513 | 1,562 | 1,681 | 1,415 | 1,510 | 1,549 | 1,652 |
| 2015 | 1,293 | 1,260 | 1,142 | 1,023 | 1,278 | 1,196 | 1,301 | 1,503 | 1,565 | 1,012 | 1,090 | 1,028 |
| 2016 | 1,367 | 1,112 | 1,281 | 1,364 | 1,387 | 1,303 | 1,385 | 1,163 | 1,162 | 1,280 | 1,357 | 1,183 |
| 2017 | 1,202 | 974 | 1,176 | 1,150 | 1,338 | 1,576 | 1,718 | 1,475 | 1,028 | 1,027 | 1,525 | 1,826 |
| 2018 | 1,322 | 698 | 899 | 883 | 904 | 768 | 1,066 | 1,043 | 1,038 | 1,128 | 911 | 985 |
| 2019 | 626 | 678 | 931 | 813 | 810 | 788 | 1,125 | 1,047 | 1,040 | 1,117 | 1,085 | 1,017 |
| 2020 | 1,056 | 898 | 867 | 810 | 864 | 953 | 1,005 | 933 | 1,040 | 321 | 790 | 954 |
| 2021 | 1,024 | 398 | 752 | 877 | 964 | 943 | 937 | 834 | 1,039 | 951 | 858 | 931 |
| 2022 | -- | -- | -- | -- | -- | -- | -- | -- | -- | -- | -- | -- |
| 2023 | -- | -- | -- | -- | -- | -- | -- | -- | -- | -- | -- | -- |
| 2024 | -- | |||||||||||
| - = No Data Reported; -- = Not Applicable; NA = Not Available; W = Withheld to avoid disclosure of individual company data. |
| Release Date: 3/29/2024 |
| Next Release Date: 4/30/2024 |
Referring Pages: