|
Download Data (XLS File) |
|
||||||||
|
||||||||
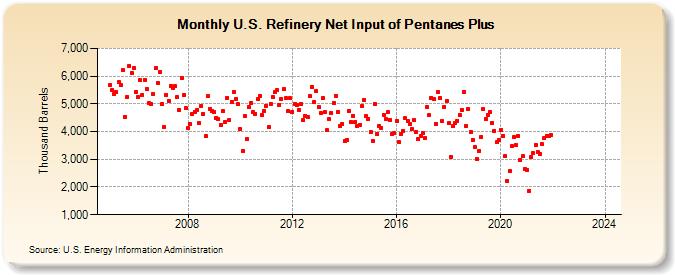
| U.S. Refinery Net Input of Pentanes Plus (Thousand Barrels) | ||||||||
| Year | Jan | Feb | Mar | Apr | May | Jun | Jul | Aug | Sep | Oct | Nov | Dec |
|---|---|---|---|---|---|---|---|---|---|---|---|---|
| 2005 | 5,678 | 5,502 | 5,344 | 5,421 | 5,783 | 5,672 | 6,208 | 4,536 | 5,244 | 6,368 | 6,130 | 6,288 |
| 2006 | 5,443 | 5,250 | 5,858 | 5,331 | 5,875 | 5,549 | 5,019 | 4,977 | 5,353 | 6,303 | 5,763 | 6,154 |
| 2007 | 5,008 | 4,166 | 5,336 | 5,094 | 5,649 | 5,572 | 5,629 | 5,244 | 4,785 | 5,941 | 5,328 | 4,839 |
| 2008 | 4,112 | 4,268 | 4,635 | 4,721 | 4,777 | 4,295 | 4,915 | 4,648 | 3,825 | 5,271 | 4,824 | 4,732 |
| 2009 | 4,690 | 4,491 | 4,450 | 4,253 | 4,730 | 4,347 | 5,227 | 4,423 | 5,082 | 5,430 | 5,188 | 4,981 |
| 2010 | 4,077 | 3,295 | 4,546 | 3,721 | 4,890 | 5,037 | 4,705 | 4,644 | 5,160 | 5,287 | 4,586 | 4,749 |
| 2011 | 4,937 | 4,172 | 5,001 | 5,258 | 5,412 | 5,481 | 4,972 | 5,173 | 5,531 | 5,197 | 4,725 | 5,200 |
| 2012 | 4,708 | 5,005 | 4,970 | 4,795 | 5,007 | 4,414 | 4,577 | 4,532 | 5,279 | 5,619 | 5,074 | 5,452 |
| 2013 | 4,878 | 4,674 | 5,210 | 4,691 | 4,040 | 4,439 | 4,667 | 5,044 | 5,293 | 4,718 | 4,212 | 4,287 |
| 2014 | 3,655 | 3,712 | 4,748 | 4,332 | 4,561 | 4,362 | 4,189 | 4,246 | 4,906 | 5,137 | 4,545 | 4,460 |
| 2015 | 4,001 | 3,664 | 4,997 | 3,909 | 4,200 | 4,121 | 4,606 | 4,453 | 4,693 | 4,431 | 3,897 | 3,932 |
| 2016 | 4,385 | 3,616 | 3,922 | 4,036 | 4,474 | 4,364 | 4,256 | 4,085 | 4,403 | 4,001 | 3,721 | 3,836 |
| 2017 | 3,943 | 3,767 | 4,893 | 4,592 | 5,228 | 5,183 | 4,290 | 5,432 | 5,208 | 4,379 | 4,903 | 5,103 |
| 2018 | 4,295 | 3,095 | 4,184 | 4,326 | 4,396 | 4,610 | 4,778 | 5,442 | 4,213 | 4,812 | 3,982 | 3,710 |
| 2019 | 3,426 | 3,004 | 3,312 | 3,805 | 4,804 | 4,454 | 4,611 | 4,709 | 4,326 | 4,032 | 3,613 | 3,693 |
| 2020 | 4,054 | 3,841 | 3,106 | 2,210 | 2,571 | 3,477 | 3,804 | 3,510 | 3,842 | 2,975 | 3,108 | 2,655 |
| 2021 | 2,624 | 1,866 | 3,084 | 3,212 | 3,517 | 3,271 | 3,207 | 3,538 | 3,750 | 3,842 | 3,837 | 3,867 |
| 2022 | -- | -- | -- | -- | -- | -- | -- | -- | -- | -- | -- | -- |
| 2023 | -- | -- | -- | -- | -- | -- | -- | -- | -- | -- | -- | -- |
| 2024 | -- | |||||||||||
| - = No Data Reported; -- = Not Applicable; NA = Not Available; W = Withheld to avoid disclosure of individual company data. |
| Release Date: 3/29/2024 |
| Next Release Date: 4/30/2024 |
Referring Pages: