|
Download Data (XLS File) |
|
||||||||
|
||||||||
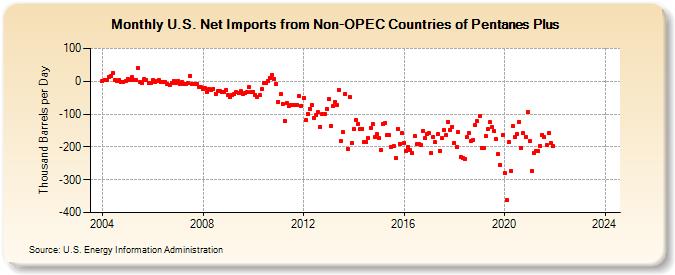
| U.S. Net Imports from Non-OPEC Countries of Pentanes Plus (Thousand Barrels per Day) | ||||||||
| Year | Jan | Feb | Mar | Apr | May | Jun | Jul | Aug | Sep | Oct | Nov | Dec |
|---|---|---|---|---|---|---|---|---|---|---|---|---|
| 2004 | 0 | 5 | 3 | 14 | 17 | 26 | 5 | 1 | 4 | -1 | -1 | 0 |
| 2005 | 8 | 3 | 12 | 5 | 4 | 41 | -2 | -6 | 8 | 4 | -5 | -4 |
| 2006 | 3 | -2 | 1 | 3 | -3 | -3 | -3 | -8 | -13 | -4 | 2 | -6 |
| 2007 | 1 | -9 | -2 | -9 | -9 | -6 | 17 | -7 | -8 | -8 | -17 | -18 |
| 2008 | -23 | -22 | -32 | -25 | -27 | -23 | -38 | -31 | -30 | -34 | -34 | -26 |
| 2009 | -43 | -48 | -43 | -39 | -34 | -36 | -31 | -40 | -37 | -33 | -19 | -34 |
| 2010 | -32 | -42 | -47 | -43 | -25 | -6 | -6 | 2 | 10 | 19 | 7 | -7 |
| 2011 | -62 | -39 | -68 | -120 | -67 | -76 | -72 | -73 | -73 | -71 | -45 | -74 |
| 2012 | -50 | -119 | -100 | -84 | -73 | -111 | -104 | -94 | -139 | -101 | -101 | -84 |
| 2013 | -55 | -137 | -76 | -62 | -71 | -26 | -182 | -156 | -38 | -206 | -48 | -189 |
| 2014 | -147 | -118 | -130 | -147 | -144 | -184 | -185 | -173 | -141 | -131 | -169 | -162 |
| 2015 | -173 | -208 | -129 | -126 | -165 | -164 | -200 | -198 | -233 | -144 | -190 | -159 |
| 2016 | -188 | -213 | -200 | -210 | -219 | -167 | -192 | -190 | -194 | -151 | -173 | -160 |
| 2017 | -159 | -218 | -169 | -186 | -160 | -211 | -173 | -150 | -164 | -123 | -149 | -138 |
| 2018 | -188 | -201 | -156 | -231 | -234 | -238 | -171 | -158 | -182 | -178 | -133 | -122 |
| 2019 | -107 | -202 | -202 | -167 | -146 | -125 | -140 | -152 | -176 | -222 | -254 | -164 |
| 2020 | -281 | -362 | -184 | -273 | -137 | -171 | -160 | -123 | -202 | -158 | -169 | -94 |
| 2021 | -183 | -272 | -218 | -213 | -211 | -198 | -163 | -170 | -195 | -159 | -187 | -196 |
| 2022 | -- | -- | -- | -- | -- | -- | -- | -- | -- | -- | -- | -- |
| 2023 | -- | -- | -- | -- | -- | -- | -- | -- | -- | -- | -- | -- |
| 2024 | -- | |||||||||||
| - = No Data Reported; -- = Not Applicable; NA = Not Available; W = Withheld to avoid disclosure of individual company data. |
| Release Date: 3/29/2024 |
| Next Release Date: 4/30/2024 |