|
Download Data (XLS File) |
|
||||||||
|
||||||||
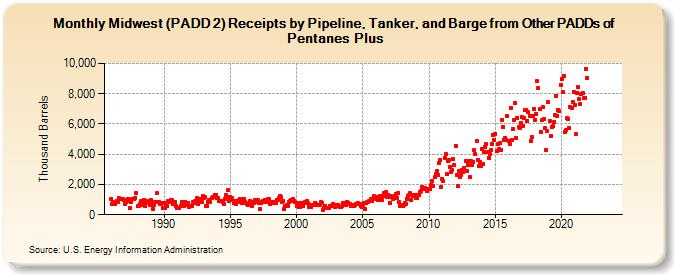
| Midwest (PADD 2) Receipts by Pipeline, Tanker, and Barge from Other PADDs of Pentanes Plus (Thousand Barrels) | ||||||||
| Year | Jan | Feb | Mar | Apr | May | Jun | Jul | Aug | Sep | Oct | Nov | Dec |
|---|---|---|---|---|---|---|---|---|---|---|---|---|
| 1986 | 1,053 | 738 | 847 | 701 | 688 | 923 | 865 | 1,097 | 1,049 | 1,053 | 1,063 | 1,055 |
| 1987 | 949 | 731 | 844 | 1,050 | 874 | 467 | 842 | 1,009 | 1,038 | 1,021 | 1,130 | 1,450 |
| 1988 | 553 | 606 | 711 | 882 | 658 | 765 | 963 | 560 | 812 | 875 | 765 | 644 |
| 1989 | 964 | 774 | 394 | 662 | 845 | 808 | 1,414 | 867 | 694 | 732 | 749 | 430 |
| 1990 | 753 | 462 | 623 | 556 | 890 | 860 | 967 | 972 | 678 | 716 | 840 | 583 |
| 1991 | 434 | 462 | 470 | 583 | 847 | 693 | 561 | 854 | 677 | 653 | 801 | 524 |
| 1992 | 584 | 549 | 825 | 786 | 889 | 856 | 1,073 | 678 | 887 | 1,012 | 815 | 1,259 |
| 1993 | 1,084 | 1,163 | 590 | 572 | 828 | 980 | 841 | 1,114 | 1,159 | 1,159 | 1,297 | 1,273 |
| 1994 | 1,079 | 1,090 | 885 | 891 | 912 | 835 | 731 | 1,007 | 1,274 | 1,185 | 1,602 | 902 |
| 1995 | 1,203 | 956 | 1,107 | 785 | 911 | 718 | 867 | 931 | 957 | 1,035 | 820 | 772 |
| 1996 | 1,068 | 860 | 804 | 700 | 628 | 674 | 930 | 862 | 581 | 800 | 952 | 989 |
| 1997 | 850 | 978 | 767 | 405 | 757 | 842 | 915 | 975 | 830 | 870 | 1,007 | 1,018 |
| 1998 | 678 | 755 | 823 | 804 | 822 | 799 | 998 | 998 | 1,135 | 1,248 | 1,152 | 839 |
| 1999 | 881 | 363 | 560 | 653 | 595 | 870 | 896 | 967 | 877 | 1,069 | 920 | 838 |
| 2000 | 584 | 775 | 515 | 512 | 769 | 720 | 550 | 765 | 851 | 877 | 784 | 532 |
| 2001 | 673 | 503 | 664 | 633 | 616 | 771 | 687 | 634 | 619 | 611 | 819 | 793 |
| 2002 | 311 | 450 | 595 | 476 | 462 | 429 | 583 | 573 | 595 | 715 | 544 | 507 |
| 2003 | 613 | 549 | 640 | 497 | 484 | 603 | 786 | 745 | 790 | 655 | 820 | 792 |
| 2004 | 676 | 606 | 669 | 600 | 608 | 610 | 720 | 708 | 751 | 685 | 553 | 505 |
| 2005 | 642 | 768 | 358 | 768 | 858 | 869 | 938 | 1,022 | 876 | 1,072 | 1,219 | 1,161 |
| 2006 | 1,156 | 1,028 | 964 | 1,185 | 1,216 | 998 | 1,267 | 1,468 | 1,236 | 1,476 | 1,188 | 1,306 |
| 2007 | 1,183 | 742 | 1,217 | 1,066 | 1,185 | 1,209 | 1,398 | 1,117 | 1,444 | 819 | 561 | 656 |
| 2008 | 557 | 646 | 747 | 731 | 1,066 | 1,264 | 1,325 | 1,404 | 971 | 1,208 | 1,293 | 1,283 |
| 2009 | 1,124 | 1,084 | 1,281 | 1,331 | 1,513 | 1,553 | 1,836 | 1,695 | 1,794 | 1,668 | 1,566 | 1,721 |
| 2010 | 1,732 | 1,686 | 1,981 | 2,224 | 1,911 | 2,466 | 2,725 | 2,888 | 2,631 | 3,431 | 3,648 | 1,828 |
| 2011 | 2,364 | 2,211 | 3,772 | 4,012 | 2,671 | 3,541 | 3,588 | 3,179 | 2,833 | 2,943 | 3,667 | 3,260 |
| 2012 | 4,568 | 2,632 | 1,878 | 2,896 | 2,485 | 2,601 | 2,959 | 2,819 | 3,088 | 3,567 | 2,896 | 3,280 |
| 2013 | 3,553 | 2,501 | 3,525 | 3,255 | 3,495 | 4,261 | 4,007 | 4,887 | 3,646 | 3,200 | 3,491 | 3,253 |
| 2014 | 4,320 | 3,357 | 4,147 | 4,471 | 4,667 | 4,134 | 3,755 | 3,983 | 4,247 | 4,649 | 5,266 | 4,960 |
| 2015 | 5,323 | 4,205 | 4,692 | 4,351 | 4,726 | 4,252 | 6,275 | 5,799 | 4,935 | 5,081 | 4,942 | 6,499 |
| 2016 | 4,905 | 4,691 | 7,027 | 4,948 | 5,695 | 6,291 | 7,384 | 5,094 | 6,413 | 5,767 | 5,731 | 6,087 |
| 2017 | 6,446 | 5,869 | 6,410 | 6,918 | 6,930 | 6,205 | 6,766 | 6,544 | 4,846 | 5,109 | 6,506 | 6,994 |
| 2018 | 6,292 | 6,639 | 8,818 | 8,383 | 6,986 | 5,488 | 6,256 | 7,129 | 6,310 | 5,715 | 4,301 | 5,549 |
| 2019 | 7,440 | 6,210 | 5,205 | 5,789 | 5,839 | 6,112 | 6,597 | 7,850 | 6,531 | 6,925 | 6,828 | 8,593 |
| 2020 | 8,942 | 8,113 | 9,181 | 5,492 | 5,602 | 6,401 | 6,303 | 5,746 | 7,145 | 7,040 | 7,466 | 8,124 |
| 2021 | 7,259 | 5,346 | 8,052 | 8,452 | 7,621 | 7,290 | 7,998 | 8,077 | 7,687 | 7,749 | 9,636 | 9,033 |
| 2022 | -- | -- | -- | -- | -- | -- | -- | -- | -- | -- | -- | -- |
| 2023 | -- | -- | -- | -- | -- | -- | -- | -- | -- | -- | -- | -- |
| 2024 | -- | |||||||||||
| - = No Data Reported; -- = Not Applicable; NA = Not Available; W = Withheld to avoid disclosure of individual company data. |
| Release Date: 3/29/2024 |
| Next Release Date: 4/30/2024 |