|
Download Data (XLS File) |
|
||||||||
|
||||||||
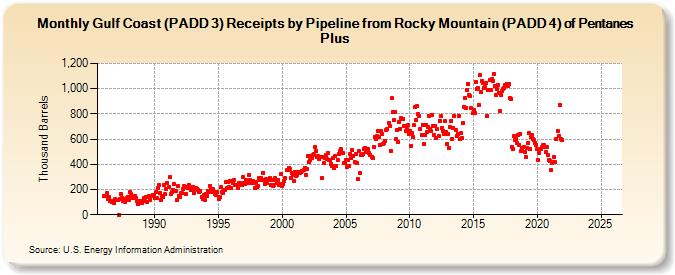
| Gulf Coast (PADD 3) Receipts by Pipeline from Rocky Mountain (PADD 4) of Pentanes Plus (Thousand Barrels) | ||||||||
| Year | Jan | Feb | Mar | Apr | May | Jun | Jul | Aug | Sep | Oct | Nov | Dec |
|---|---|---|---|---|---|---|---|---|---|---|---|---|
| 1986 | 148 | 148 | 151 | 169 | 128 | 137 | 105 | 107 | 104 | 109 | 95 | 123 |
| 1987 | 115 | 113 | 0 | 126 | 165 | 135 | 112 | 122 | 103 | 117 | 136 | 141 |
| 1988 | 120 | 182 | 161 | 148 | 129 | 152 | 132 | 106 | 83 | 107 | 105 | 103 |
| 1989 | 96 | 111 | 133 | 107 | 141 | 103 | 139 | 148 | 120 | 148 | 157 | 156 |
| 1990 | 134 | 179 | 131 | 213 | 233 | 169 | 116 | 151 | 142 | 236 | 162 | 202 |
| 1991 | 252 | 221 | 299 | 162 | 177 | 197 | 244 | 190 | 186 | 117 | 227 | 146 |
| 1992 | 141 | 171 | 169 | 201 | 225 | 168 | 221 | 211 | 236 | 210 | 195 | 214 |
| 1993 | 218 | 169 | 203 | 213 | 207 | 199 | 183 | 186 | 142 | 121 | 153 | 115 |
| 1994 | 168 | 149 | 192 | 183 | 230 | 206 | 177 | 201 | 180 | 163 | 158 | 177 |
| 1995 | 124 | 143 | 217 | 179 | 176 | 198 | 196 | 263 | 211 | 257 | 218 | 269 |
| 1996 | 215 | 268 | 248 | 274 | 237 | 239 | 213 | 251 | 248 | 245 | 238 | 296 |
| 1997 | 253 | 241 | 275 | 252 | 266 | 314 | 272 | 251 | 265 | 248 | 209 | 261 |
| 1998 | 223 | 225 | 289 | 275 | 289 | 274 | 334 | 277 | 242 | 282 | 253 | 279 |
| 1999 | 288 | 234 | 274 | 227 | 239 | 289 | 276 | 255 | 278 | 234 | 245 | 322 |
| 2000 | 230 | 245 | 269 | 288 | 351 | 351 | 372 | 361 | 295 | 333 | 319 | 266 |
| 2001 | 337 | 310 | 314 | 337 | 328 | 333 | 340 | 349 | 352 | 373 | 318 | 362 |
| 2002 | 466 | 418 | 432 | 468 | 453 | 470 | 482 | 535 | 506 | 456 | 464 | 439 |
| 2003 | 461 | 293 | 461 | 411 | 449 | 471 | 443 | 487 | 437 | 437 | 406 | 390 |
| 2004 | 450 | 368 | 462 | 388 | 437 | 480 | 502 | 518 | 490 | 488 | 414 | 407 |
| 2005 | 435 | 381 | 431 | 387 | 485 | 449 | 511 | 465 | 422 | 479 | 411 | 281 |
| 2006 | 503 | 331 | 470 | 476 | 479 | 523 | 529 | 497 | 509 | 519 | 488 | 472 |
| 2007 | 457 | 449 | 535 | 619 | 597 | 621 | 667 | 618 | 556 | 665 | 639 | 561 |
| 2008 | 568 | 585 | 670 | 677 | 728 | 700 | 508 | 924 | 818 | 753 | 818 | 599 |
| 2009 | 676 | 578 | 739 | 684 | 767 | 759 | 763 | 707 | 665 | 677 | 709 | 642 |
| 2010 | 661 | 547 | 649 | 620 | 709 | 853 | 750 | 859 | 798 | 781 | 680 | 635 |
| 2011 | 714 | 560 | 630 | 709 | 654 | 699 | 784 | 684 | 663 | 795 | 705 | 629 |
| 2012 | 705 | 610 | 677 | 624 | 747 | 780 | 690 | 668 | 644 | 741 | 653 | 561 |
| 2013 | 637 | 533 | 698 | 747 | 603 | 689 | 783 | 675 | 626 | 642 | 784 | 597 |
| 2014 | 647 | 606 | 729 | 856 | 924 | 849 | 993 | 1,040 | 948 | 943 | 848 | 805 |
| 2015 | 833 | 810 | 1,053 | 997 | 1,007 | 872 | 1,105 | 977 | 1,060 | 1,043 | 1,008 | 1,010 |
| 2016 | 1,049 | 780 | 987 | 1,066 | 993 | 1,073 | 1,058 | 1,119 | 1,023 | 947 | 1,000 | 1,030 |
| 2017 | 966 | 826 | 948 | 980 | 997 | 1,005 | 1,027 | 1,039 | 1,022 | 1,039 | 926 | 922 |
| 2018 | 540 | 519 | 626 | 594 | 597 | 566 | 629 | 555 | 641 | 507 | 527 | 539 |
| 2019 | 501 | 460 | 530 | 569 | 646 | 522 | 615 | 631 | 598 | 590 | 568 | 552 |
| 2020 | 519 | 434 | 492 | 525 | 534 | 550 | 553 | 536 | 497 | 534 | 472 | 436 |
| 2021 | 428 | 351 | 413 | 416 | 458 | 415 | 602 | 667 | 627 | 874 | 598 | 594 |
| 2022 | -- | -- | -- | -- | -- | -- | -- | -- | -- | -- | -- | -- |
| 2023 | -- | -- | -- | -- | -- | -- | -- | -- | -- | -- | -- | -- |
| 2024 | -- | |||||||||||
| - = No Data Reported; -- = Not Applicable; NA = Not Available; W = Withheld to avoid disclosure of individual company data. |
| Release Date: 3/29/2024 |
| Next Release Date: 4/30/2024 |