|
Download Data (XLS File) |
|
||||||||
|
||||||||
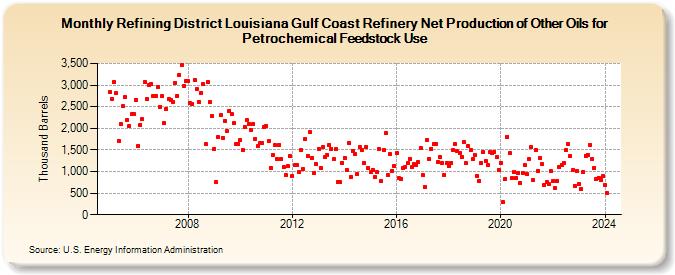
| Refining District Louisiana Gulf Coast Refinery Net Production of Other Oils for Petrochemical Feedstock Use (Thousand Barrels) | ||||||||
| Year | Jan | Feb | Mar | Apr | May | Jun | Jul | Aug | Sep | Oct | Nov | Dec |
|---|---|---|---|---|---|---|---|---|---|---|---|---|
| 2005 | 2,836 | 2,684 | 3,077 | 2,812 | 1,706 | 2,094 | 2,508 | 2,716 | 2,197 | 2,048 | 2,329 | 2,336 |
| 2006 | 2,664 | 1,601 | 2,078 | 2,207 | 3,074 | 2,678 | 3,010 | 3,018 | 2,757 | 2,753 | 2,958 | 2,504 |
| 2007 | 2,746 | 2,120 | 2,455 | 2,676 | 2,663 | 2,619 | 3,055 | 2,756 | 3,244 | 3,456 | 2,989 | 3,094 |
| 2008 | 3,088 | 2,578 | 2,559 | 3,122 | 2,903 | 2,610 | 2,822 | 3,018 | 1,630 | 3,066 | 2,607 | 2,276 |
| 2009 | 1,528 | 751 | 1,791 | 2,302 | 1,783 | 2,176 | 1,938 | 2,404 | 2,336 | 2,122 | 1,632 | 1,642 |
| 2010 | 1,723 | 1,492 | 2,041 | 2,187 | 2,099 | 1,964 | 2,104 | 1,755 | 1,587 | 1,651 | 1,657 | 2,039 |
| 2011 | 2,048 | 1,700 | 1,089 | 1,381 | 1,608 | 1,286 | 1,621 | 1,286 | 1,098 | 923 | 1,118 | 1,364 |
| 2012 | 900 | 1,140 | 1,152 | 982 | 1,498 | 1,053 | 1,761 | 1,366 | 1,904 | 1,322 | 967 | 1,166 |
| 2013 | 1,511 | 1,086 | 1,564 | 1,331 | 1,388 | 1,618 | 1,531 | 1,283 | 1,515 | 758 | 757 | 1,205 |
| 2014 | 1,318 | 1,037 | 1,656 | 884 | 1,483 | 1,401 | 945 | 1,570 | 1,493 | 1,204 | 1,568 | 1,072 |
| 2015 | 977 | 1,043 | 869 | 979 | 1,527 | 769 | 1,508 | 1,887 | 909 | 1,394 | 1,018 | 1,126 |
| 2016 | 1,422 | 840 | 837 | 1,081 | 1,113 | 1,190 | 1,299 | 1,096 | 1,171 | 1,155 | 1,218 | 1,540 |
| 2017 | 909 | 642 | 1,731 | 1,290 | 1,526 | 1,627 | 1,643 | 1,229 | 1,328 | 1,198 | 924 | 1,197 |
| 2018 | 1,134 | 1,206 | 1,499 | 1,636 | 1,470 | 1,439 | 1,345 | 1,679 | 1,187 | 1,587 | 1,502 | 1,289 |
| 2019 | 1,387 | 907 | 785 | 1,204 | 1,440 | 1,242 | 1,144 | 1,446 | 1,425 | 1,459 | 1,340 | 1,038 |
| 2020 | 1,207 | 283 | 838 | 1,799 | 1,424 | 843 | 979 | 849 | 972 | 731 | 960 | 1,144 |
| 2021 | 946 | 1,295 | 1,556 | 797 | 1,492 | 1,021 | 1,316 | 1,165 | 694 | 758 | 710 | 1,007 |
| 2022 | 783 | 613 | 785 | 1,099 | 1,159 | 1,204 | 1,489 | 1,628 | 1,361 | 1,027 | 675 | 1,004 |
| 2023 | 722 | 606 | 988 | 1,368 | 1,387 | 1,622 | 1,285 | 1,089 | 828 | 852 | 814 | 889 |
| 2024 | 680 | |||||||||||
| - = No Data Reported; -- = Not Applicable; NA = Not Available; W = Withheld to avoid disclosure of individual company data. |
| Release Date: 3/29/2024 |
| Next Release Date: 4/30/2024 |