|
Download Data (XLS File) |
|
||||||||
|
||||||||
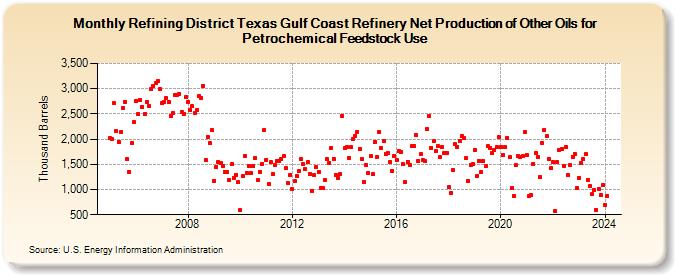
| Refining District Texas Gulf Coast Refinery Net Production of Other Oils for Petrochemical Feedstock Use (Thousand Barrels) | ||||||||
| Year | Jan | Feb | Mar | Apr | May | Jun | Jul | Aug | Sep | Oct | Nov | Dec |
|---|---|---|---|---|---|---|---|---|---|---|---|---|
| 2005 | 2,015 | 2,006 | 2,708 | 2,156 | 1,938 | 2,133 | 2,618 | 2,737 | 1,601 | 1,354 | 1,913 | 2,331 |
| 2006 | 2,752 | 2,492 | 2,782 | 2,637 | 2,493 | 2,745 | 2,653 | 2,988 | 3,049 | 3,103 | 3,144 | 2,992 |
| 2007 | 2,707 | 2,742 | 2,809 | 2,732 | 2,461 | 2,517 | 2,869 | 2,879 | 2,903 | 2,533 | 2,504 | 2,829 |
| 2008 | 2,738 | 2,577 | 2,654 | 2,521 | 2,573 | 2,849 | 2,819 | 3,057 | 1,586 | 2,048 | 1,919 | 2,187 |
| 2009 | 1,178 | 1,447 | 1,543 | 1,534 | 1,476 | 1,354 | 1,343 | 1,197 | 1,505 | 1,235 | 1,297 | 1,143 |
| 2010 | 590 | 1,262 | 1,673 | 1,328 | 1,469 | 1,319 | 1,465 | 1,632 | 1,182 | 1,357 | 1,506 | 2,181 |
| 2011 | 1,592 | 1,113 | 1,540 | 1,304 | 1,489 | 1,572 | 1,565 | 1,603 | 1,662 | 1,429 | 1,122 | 1,288 |
| 2012 | 1,002 | 1,159 | 1,276 | 1,369 | 1,599 | 1,507 | 1,398 | 1,540 | 1,313 | 980 | 1,290 | 1,440 |
| 2013 | 1,356 | 1,022 | 1,028 | 1,187 | 1,599 | 1,532 | 1,831 | 1,611 | 1,282 | 1,234 | 1,301 | 2,462 |
| 2014 | 1,818 | 1,834 | 1,625 | 1,836 | 2,001 | 2,063 | 2,148 | 1,812 | 1,613 | 1,153 | 1,482 | 1,333 |
| 2015 | 1,655 | 1,302 | 1,952 | 1,648 | 2,149 | 1,823 | 1,964 | 1,705 | 1,722 | 1,550 | 1,371 | 1,670 |
| 2016 | 1,580 | 1,757 | 1,749 | 1,499 | 1,143 | 1,551 | 1,495 | 1,861 | 1,866 | 2,072 | 1,570 | 1,696 |
| 2017 | 1,595 | 1,562 | 2,196 | 2,451 | 1,832 | 1,962 | 1,767 | 1,854 | 1,637 | 1,842 | 1,725 | 1,725 |
| 2018 | 1,043 | 936 | 1,387 | 1,893 | 1,851 | 1,972 | 2,064 | 2,018 | 1,622 | 1,178 | 1,482 | 1,497 |
| 2019 | 1,788 | 1,273 | 1,572 | 1,342 | 1,562 | 1,463 | 1,854 | 1,830 | 1,726 | 1,785 | 1,841 | 2,035 |
| 2020 | 1,844 | 1,686 | 1,837 | 2,024 | 1,636 | 1,036 | 872 | 1,485 | 1,661 | 1,637 | 1,659 | 2,150 |
| 2021 | 1,681 | 864 | 899 | 1,512 | 1,726 | 1,646 | 1,250 | 1,931 | 2,190 | 2,061 | 1,604 | 1,426 |
| 2022 | 1,540 | 567 | 1,549 | 1,793 | 1,800 | 1,466 | 1,843 | 1,281 | 1,481 | 1,649 | 1,706 | 1,039 |
| 2023 | 1,233 | 1,529 | 1,597 | 1,702 | 1,181 | 1,072 | 910 | 989 | 595 | 1,019 | 893 | 1,093 |
| 2024 | 700 | 869 | 1,404 | 1,002 | 965 | 841 | ||||||
| - = No Data Reported; -- = Not Applicable; NA = Not Available; W = Withheld to avoid disclosure of individual company data. |
| Release Date: 8/30/2024 |
| Next Release Date: 9/30/2024 |