|
Download Data (XLS File) |
|
||||||||
|
||||||||
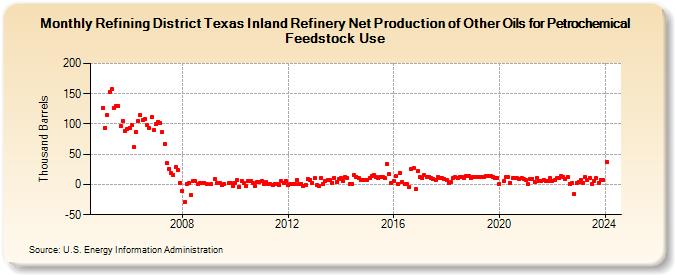
| Refining District Texas Inland Refinery Net Production of Other Oils for Petrochemical Feedstock Use (Thousand Barrels) | ||||||||
| Year | Jan | Feb | Mar | Apr | May | Jun | Jul | Aug | Sep | Oct | Nov | Dec |
|---|---|---|---|---|---|---|---|---|---|---|---|---|
| 2005 | 127 | 94 | 115 | 153 | 157 | 126 | 129 | 130 | 96 | 105 | 89 | 92 |
| 2006 | 94 | 98 | 62 | 87 | 105 | 115 | 106 | 108 | 98 | 93 | 111 | 90 |
| 2007 | 100 | 104 | 102 | 87 | 67 | 35 | 26 | 19 | 16 | 29 | 24 | 3 |
| 2008 | -10 | -29 | 1 | 2 | -18 | 5 | 5 | 1 | 2 | 2 | 3 | 1 |
| 2009 | 1 | 9 | 2 | 2 | -1 | 1 | 2 | 3 | -2 | |||
| 2010 | 3 | 7 | -5 | 6 | 2 | -3 | 6 | 5 | 3 | -2 | 4 | 4 |
| 2011 | 6 | 0 | 4 | 0 | 1 | -1 | 1 | 0 | -1 | 5 | 3 | 6 |
| 2012 | -1 | 0 | 1 | 0 | 7 | 0 | 1 | -2 | -1 | 9 | 8 | 2 |
| 2013 | 10 | -1 | -3 | 11 | 1 | 6 | 7 | 7 | 3 | 11 | 4 | 9 |
| 2014 | 11 | 6 | 13 | 11 | 0 | 1 | 15 | 13 | 10 | 8 | 7 | 8 |
| 2015 | 8 | 11 | 14 | 16 | 13 | 11 | 13 | 13 | 10 | 34 | 17 | 3 |
| 2016 | 5 | 14 | 1 | 19 | 4 | 1 | 0 | -4 | 25 | 27 | -8 | 22 |
| 2017 | 12 | 10 | 15 | 13 | 13 | 10 | 9 | 7 | 12 | 10 | 10 | 9 |
| 2018 | 7 | 2 | 4 | 11 | 12 | 10 | 13 | 13 | 11 | 14 | 14 | 11 |
| 2019 | 13 | 12 | 13 | 12 | 12 | 13 | 14 | 14 | 14 | 13 | 10 | 11 |
| 2020 | 1 | 5 | 12 | 12 | 3 | 10 | 11 | 10 | 9 | 11 | 9 | |
| 2021 | 7 | 1 | 9 | 9 | 4 | 11 | 5 | 6 | 8 | 6 | 5 | 10 |
| 2022 | 5 | 7 | 10 | 11 | 14 | 12 | 9 | 12 | 1 | 2 | -16 | 2 |
| 2023 | 4 | 8 | 3 | 12 | 7 | 11 | 1 | 6 | 10 | 3 | 7 | 7 |
| - = No Data Reported; -- = Not Applicable; NA = Not Available; W = Withheld to avoid disclosure of individual company data. |
| Release Date: 3/29/2024 |
| Next Release Date: 4/30/2024 |