|
Download Data (XLS File) |
|
||||||||
|
||||||||
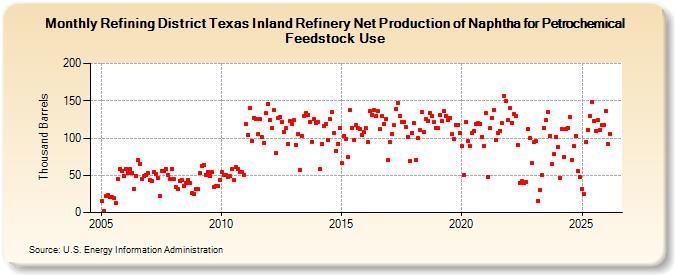
| Refining District Texas Inland Refinery Net Production of Naphtha for Petrochemical Feedstock Use (Thousand Barrels) | ||||||||
| Year | Jan | Feb | Mar | Apr | May | Jun | Jul | Aug | Sep | Oct | Nov | Dec |
|---|---|---|---|---|---|---|---|---|---|---|---|---|
| 2005 | 16 | 2 | 22 | 23 | 21 | 21 | 19 | 13 | 45 | 59 | 56 | 49 |
| 2006 | 59 | 53 | 58 | 53 | 32 | 49 | 70 | 65 | 45 | 49 | 51 | 53 |
| 2007 | 44 | 43 | 55 | 52 | 47 | 22 | 56 | 56 | 59 | 51 | 45 | 59 |
| 2008 | 45 | 34 | 31 | 43 | 44 | 36 | 40 | 44 | 40 | 26 | 25 | 32 |
| 2009 | 31 | 53 | 63 | 64 | 51 | 55 | 49 | 54 | 34 | 36 | 36 | 44 |
| 2010 | 54 | 51 | 51 | 48 | 49 | 58 | 44 | 61 | 59 | 54 | 54 | 50 |
| 2011 | 119 | 104 | 140 | 96 | 127 | 126 | 105 | 125 | 101 | 93 | 133 | 146 |
| 2012 | 124 | 113 | 137 | 80 | 127 | 128 | 122 | 108 | 113 | 92 | 123 | 119 |
| 2013 | 124 | 91 | 106 | 57 | 103 | 129 | 134 | 131 | 122 | 95 | 125 | 120 |
| 2014 | 122 | 59 | 92 | 116 | 119 | 97 | 126 | 135 | 107 | 82 | 92 | 114 |
| 2015 | 66 | 103 | 99 | 74 | 137 | 113 | 97 | 117 | 113 | 112 | 104 | 108 |
| 2016 | 113 | 94 | 136 | 131 | 137 | 129 | 136 | 112 | 129 | 119 | 126 | 70 |
| 2017 | 94 | 105 | 117 | 139 | 147 | 130 | 122 | 121 | 115 | 102 | 69 | 107 |
| 2018 | 120 | 71 | 100 | 111 | 135 | 108 | 125 | 123 | 134 | 130 | 121 | 113 |
| 2019 | 113 | 131 | 123 | 136 | 130 | 124 | 127 | 105 | 99 | 118 | 118 | 107 |
| 2020 | 89 | 51 | 121 | 96 | 89 | 107 | 109 | 119 | 120 | 119 | 102 | 89 |
| 2021 | 133 | 48 | 113 | 127 | 138 | 98 | 107 | 110 | 120 | 156 | 149 | 124 |
| 2022 | 140 | 120 | 132 | 129 | 91 | 40 | 42 | 40 | 41 | 112 | 100 | 66 |
| 2023 | 94 | 96 | 16 | 30 | 50 | 114 | 124 | 135 | 103 | 65 | 78 | 102 |
| 2024 | 88 | |||||||||||
| - = No Data Reported; -- = Not Applicable; NA = Not Available; W = Withheld to avoid disclosure of individual company data. |
| Release Date: 3/29/2024 |
| Next Release Date: 4/30/2024 |