|
Download Data (XLS File) |
|
||||||||
|
||||||||
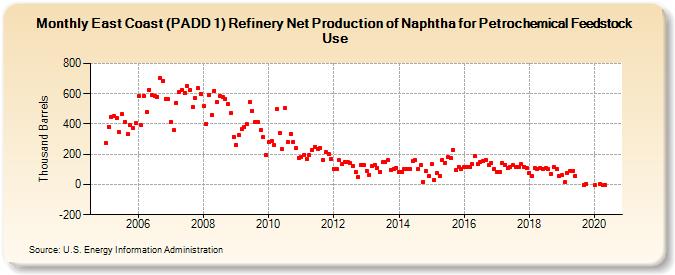
| East Coast (PADD 1) Refinery Net Production of Naphtha for Petrochemical Feedstock Use (Thousand Barrels) | ||||||||
| Year | Jan | Feb | Mar | Apr | May | Jun | Jul | Aug | Sep | Oct | Nov | Dec |
|---|---|---|---|---|---|---|---|---|---|---|---|---|
| 2005 | 273 | 382 | 444 | 456 | 438 | 344 | 463 | 416 | 332 | 391 | 375 | 404 |
| 2006 | 586 | 390 | 588 | 480 | 627 | 593 | 584 | 581 | 704 | 685 | 567 | 563 |
| 2007 | 414 | 358 | 539 | 613 | 623 | 602 | 649 | 624 | 510 | 571 | 636 | 601 |
| 2008 | 518 | 400 | 593 | 460 | 621 | 544 | 585 | 576 | 566 | 534 | 472 | 316 |
| 2009 | 262 | 325 | 365 | 378 | 399 | 544 | 488 | 410 | 414 | 361 | 311 | 196 |
| 2010 | 281 | 289 | 259 | 496 | 341 | 234 | 503 | 281 | 335 | 282 | 241 | 177 |
| 2011 | 184 | 198 | 170 | 194 | 226 | 251 | 232 | 242 | 165 | 213 | 199 | 171 |
| 2012 | 104 | 99 | 160 | 133 | 146 | 146 | 139 | 125 | 82 | 49 | 131 | 130 |
| 2013 | 92 | 62 | 119 | 130 | 111 | 85 | 146 | 146 | 160 | 95 | 103 | 111 |
| 2014 | 81 | 83 | 105 | 99 | 105 | 154 | 161 | 99 | 128 | 19 | 89 | 53 |
| 2015 | 133 | 31 | 76 | 53 | 164 | 145 | 183 | 174 | 228 | 97 | 116 | 105 |
| 2016 | 118 | 114 | 113 | 133 | 185 | 136 | 149 | 153 | 163 | 128 | 145 | 103 |
| 2017 | 80 | 85 | 144 | 129 | 109 | 115 | 127 | 117 | 117 | 133 | 117 | 108 |
| 2018 | 78 | 53 | 108 | 102 | 106 | 105 | 108 | 100 | 71 | 114 | 104 | 56 |
| 2019 | 62 | 14 | 77 | 88 | 91 | 59 | -6 | 5 | ||||
| 2020 | -2 | 2 | -3 | -2 | ||||||||
| - = No Data Reported; -- = Not Applicable; NA = Not Available; W = Withheld to avoid disclosure of individual company data. |
| Release Date: 8/30/2024 |
| Next Release Date: 9/30/2024 |