|
Download Data (XLS File) |
|
||||||||
|
||||||||
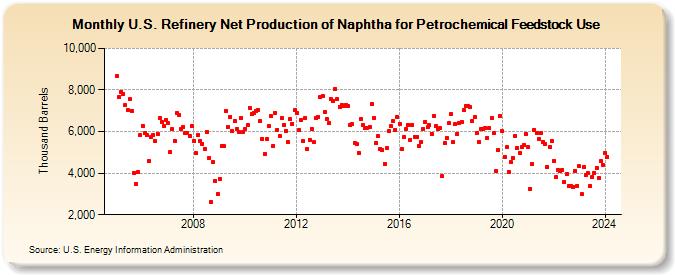
| U.S. Refinery Net Production of Naphtha for Petrochemical Feedstock Use (Thousand Barrels) | ||||||||
| Year | Jan | Feb | Mar | Apr | May | Jun | Jul | Aug | Sep | Oct | Nov | Dec |
|---|---|---|---|---|---|---|---|---|---|---|---|---|
| 2005 | 8,650 | 7,679 | 7,891 | 7,821 | 7,254 | 7,058 | 7,552 | 7,003 | 4,030 | 3,479 | 4,049 | 5,820 |
| 2006 | 6,285 | 5,917 | 5,816 | 4,567 | 5,718 | 5,840 | 5,538 | 5,893 | 6,641 | 6,480 | 6,278 | 6,575 |
| 2007 | 6,397 | 5,024 | 6,110 | 5,559 | 6,896 | 6,812 | 6,118 | 6,227 | 5,919 | 5,917 | 5,775 | 6,280 |
| 2008 | 5,564 | 4,952 | 5,848 | 5,549 | 5,423 | 5,174 | 5,983 | 4,736 | 2,611 | 4,521 | 3,630 | 3,008 |
| 2009 | 3,741 | 5,326 | 5,295 | 7,008 | 6,234 | 6,716 | 6,006 | 6,507 | 6,124 | 5,979 | 6,669 | 5,998 |
| 2010 | 6,135 | 6,339 | 7,148 | 6,852 | 6,893 | 6,995 | 7,037 | 6,498 | 5,654 | 4,923 | 5,643 | 6,250 |
| 2011 | 6,735 | 5,312 | 6,916 | 6,098 | 5,782 | 6,642 | 6,339 | 6,050 | 5,495 | 6,591 | 6,373 | 7,014 |
| 2012 | 6,892 | 6,051 | 6,546 | 5,541 | 6,640 | 5,160 | 5,610 | 6,136 | 5,474 | 6,653 | 6,702 | 7,649 |
| 2013 | 7,708 | 6,951 | 6,618 | 6,409 | 7,562 | 7,490 | 8,067 | 7,544 | 7,193 | 7,289 | 7,229 | 7,297 |
| 2014 | 7,213 | 6,334 | 6,354 | 5,472 | 5,378 | 4,970 | 6,608 | 6,310 | 6,189 | 6,173 | 6,215 | 7,337 |
| 2015 | 6,673 | 5,443 | 5,778 | 5,165 | 5,105 | 4,442 | 5,196 | 6,022 | 6,252 | 6,499 | 6,088 | 6,712 |
| 2016 | 6,370 | 5,160 | 5,742 | 6,119 | 6,336 | 5,614 | 6,338 | 5,759 | 5,759 | 5,328 | 5,496 | 6,138 |
| 2017 | 6,478 | 6,202 | 6,301 | 5,903 | 6,760 | 6,253 | 6,105 | 6,168 | 3,862 | 5,431 | 5,711 | 6,404 |
| 2018 | 6,830 | 5,488 | 6,353 | 5,896 | 6,402 | 6,466 | 7,026 | 7,246 | 7,233 | 7,173 | 6,499 | 6,680 |
| 2019 | 5,911 | 5,521 | 6,100 | 6,110 | 6,191 | 5,712 | 6,160 | 6,652 | 5,950 | 4,084 | 5,119 | 6,767 |
| 2020 | 6,004 | 4,795 | 5,233 | 4,078 | 4,532 | 4,748 | 5,805 | 5,215 | 4,983 | 5,261 | 5,362 | 5,896 |
| 2021 | 5,234 | 3,256 | 4,429 | 6,081 | 5,919 | 5,652 | 5,931 | 5,515 | 5,407 | 4,291 | 5,266 | 5,567 |
| 2022 | 4,599 | 3,796 | 4,151 | 4,083 | 4,161 | 3,593 | 3,958 | 3,376 | 3,370 | 3,335 | 4,124 | 3,386 |
| 2023 | 4,323 | 2,973 | 4,306 | 3,908 | 4,016 | 3,402 | 3,811 | 4,021 | 4,261 | 3,789 | 4,579 | 4,411 |
| 2024 | 4,991 | |||||||||||
| - = No Data Reported; -- = Not Applicable; NA = Not Available; W = Withheld to avoid disclosure of individual company data. |
| Release Date: 3/29/2024 |
| Next Release Date: 4/30/2024 |