|
Download Data (XLS File) |
|
||||||||
|
||||||||
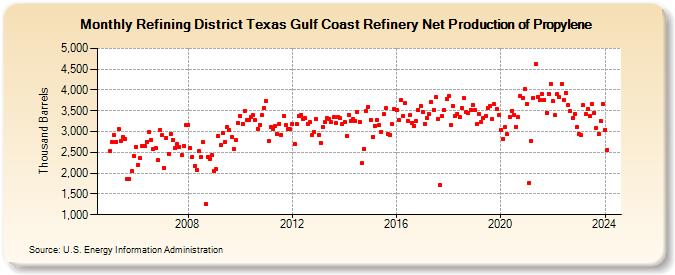
| Refining District Texas Gulf Coast Refinery Net Production of Propylene (Thousand Barrels) | ||||||||
| Year | Jan | Feb | Mar | Apr | May | Jun | Jul | Aug | Sep | Oct | Nov | Dec |
|---|---|---|---|---|---|---|---|---|---|---|---|---|
| 2005 | 2,523 | 2,755 | 2,915 | 2,757 | 3,059 | 2,771 | 2,868 | 2,824 | 1,858 | 1,868 | 2,050 | 2,412 |
| 2006 | 2,633 | 2,205 | 2,352 | 2,648 | 2,660 | 2,759 | 2,992 | 2,792 | 2,572 | 2,602 | 2,311 | 3,043 |
| 2007 | 2,921 | 2,134 | 2,854 | 2,470 | 2,947 | 2,793 | 2,606 | 2,691 | 2,637 | 2,432 | 2,654 | 3,152 |
| 2008 | 3,167 | 2,601 | 2,388 | 2,167 | 2,078 | 2,532 | 2,384 | 2,739 | 1,257 | 2,393 | 2,350 | 2,426 |
| 2009 | 2,049 | 2,092 | 2,886 | 2,669 | 2,967 | 2,758 | 3,101 | 3,039 | 2,870 | 2,580 | 2,792 | 3,207 |
| 2010 | 3,371 | 3,185 | 3,504 | 3,276 | 3,280 | 3,350 | 3,389 | 3,278 | 3,063 | 3,166 | 3,394 | 3,578 |
| 2011 | 3,734 | 2,776 | 3,098 | 3,069 | 3,132 | 2,936 | 3,182 | 2,925 | 3,373 | 3,146 | 3,054 | 3,057 |
| 2012 | 3,180 | 2,704 | 3,176 | 3,370 | 3,403 | 3,294 | 3,318 | 3,190 | 3,220 | 2,914 | 2,999 | 3,303 |
| 2013 | 2,918 | 2,735 | 3,121 | 3,226 | 3,323 | 3,305 | 3,222 | 3,348 | 3,194 | 3,349 | 3,316 | 3,187 |
| 2014 | 3,228 | 2,899 | 3,408 | 3,254 | 3,307 | 3,249 | 3,461 | 3,236 | 2,235 | 2,592 | 3,494 | 3,594 |
| 2015 | 3,284 | 2,878 | 3,141 | 3,286 | 3,151 | 2,998 | 3,414 | 3,555 | 2,947 | 2,919 | 3,175 | 3,534 |
| 2016 | 3,516 | 3,277 | 3,756 | 3,375 | 3,678 | 3,260 | 3,390 | 3,212 | 3,144 | 3,242 | 3,523 | 3,615 |
| 2017 | 3,473 | 3,184 | 3,336 | 3,414 | 3,716 | 3,525 | 3,830 | 3,302 | 1,708 | 3,372 | 3,510 | 3,791 |
| 2018 | 3,860 | 3,158 | 3,610 | 3,365 | 3,429 | 3,345 | 3,572 | 3,808 | 3,477 | 3,449 | 3,528 | 3,650 |
| 2019 | 3,516 | 3,184 | 3,424 | 3,226 | 3,330 | 3,372 | 3,569 | 3,609 | 3,296 | 3,652 | 3,537 | 3,407 |
| 2020 | 3,049 | 2,826 | 3,104 | 2,930 | 3,358 | 3,506 | 3,406 | 3,120 | 3,341 | 3,849 | 3,797 | 4,017 |
| 2021 | 3,668 | 1,770 | 2,772 | 3,809 | 4,619 | 3,839 | 3,753 | 3,911 | 3,760 | 3,456 | 3,915 | 4,146 |
| 2022 | 3,723 | 3,398 | 3,895 | 3,827 | 4,148 | 3,768 | 3,937 | 3,633 | 3,486 | 3,316 | 3,427 | 3,104 |
| 2023 | 2,939 | 2,908 | 3,632 | 3,420 | 3,548 | 3,369 | 3,662 | 3,455 | 3,077 | 2,945 | 3,253 | 3,664 |
| 2024 | 3,039 | |||||||||||
| - = No Data Reported; -- = Not Applicable; NA = Not Available; W = Withheld to avoid disclosure of individual company data. |
| Release Date: 3/29/2024 |
| Next Release Date: 4/30/2024 |