|
Download Data (XLS File) |
|
||||||||
|
||||||||
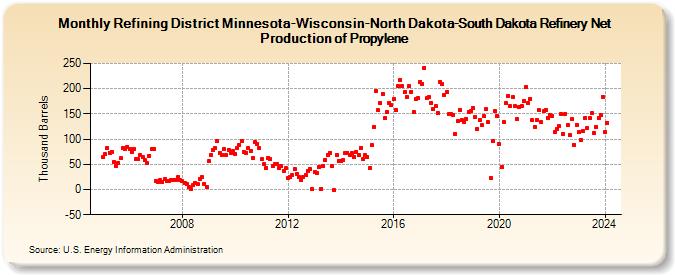
| Refining District Minnesota-Wisconsin-North Dakota-South Dakota Refinery Net Production of Propylene (Thousand Barrels) | ||||||||
| Year | Jan | Feb | Mar | Apr | May | Jun | Jul | Aug | Sep | Oct | Nov | Dec |
|---|---|---|---|---|---|---|---|---|---|---|---|---|
| 2005 | 64 | 70 | 83 | 73 | 75 | 55 | 47 | 53 | 62 | 83 | 81 | 85 |
| 2006 | 81 | 74 | 81 | 60 | 60 | 68 | 64 | 58 | 52 | 67 | 80 | 81 |
| 2007 | 17 | 15 | 19 | 15 | 20 | 17 | 16 | 19 | 18 | 19 | 24 | 18 |
| 2008 | 16 | 12 | 11 | 5 | 1 | 8 | 13 | 10 | 21 | 24 | 11 | 4 |
| 2009 | 56 | 69 | 78 | 82 | 97 | 73 | 69 | 80 | 68 | 79 | 72 | 76 |
| 2010 | 71 | 83 | 89 | 97 | 74 | 73 | 82 | 76 | 63 | 94 | 90 | 82 |
| 2011 | 60 | 50 | 42 | 63 | 60 | 46 | 50 | 51 | 43 | 46 | 37 | 42 |
| 2012 | 23 | 24 | 28 | 41 | 31 | 24 | 18 | 25 | 29 | 37 | 41 | 1 |
| 2013 | 35 | 32 | 44 | 2 | 47 | 59 | 69 | 73 | 46 | -1 | 68 | 56 |
| 2014 | 56 | 59 | 72 | 73 | 69 | 72 | 65 | 75 | 68 | 83 | 60 | 68 |
| 2015 | 64 | 42 | 88 | 124 | 196 | 157 | 172 | 190 | 141 | 153 | 172 | 167 |
| 2016 | 180 | 157 | 205 | 217 | 205 | 193 | 184 | 205 | 194 | 154 | 179 | 181 |
| 2017 | 214 | 210 | 242 | 181 | 183 | 172 | 159 | 165 | 151 | 214 | 209 | 188 |
| 2018 | 194 | 149 | 149 | 148 | 111 | 135 | 158 | 137 | 134 | 140 | 154 | 155 |
| 2019 | 162 | 144 | 120 | 137 | 128 | 145 | 159 | 133 | 23 | 96 | 155 | 146 |
| 2020 | 90 | 44 | 134 | 171 | 186 | 165 | 184 | 165 | 139 | 163 | 166 | 176 |
| 2021 | 203 | 171 | 180 | 137 | 124 | 138 | 157 | 133 | 155 | 158 | 142 | 148 |
| 2022 | 146 | 115 | 120 | 125 | 149 | 110 | 150 | 127 | 108 | 140 | 89 | 128 |
| 2023 | 114 | 99 | 116 | 142 | 122 | 141 | 151 | 112 | 124 | 142 | 147 | 184 |
| 2024 | 114 | |||||||||||
| - = No Data Reported; -- = Not Applicable; NA = Not Available; W = Withheld to avoid disclosure of individual company data. |
| Release Date: 3/29/2024 |
| Next Release Date: 4/30/2024 |