|
Download Data (XLS File) |
|
||||||||
|
||||||||
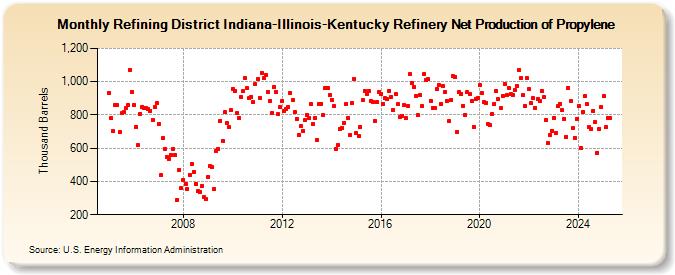
| Refining District Indiana-Illinois-Kentucky Refinery Net Production of Propylene (Thousand Barrels) | ||||||||
| Year | Jan | Feb | Mar | Apr | May | Jun | Jul | Aug | Sep | Oct | Nov | Dec |
|---|---|---|---|---|---|---|---|---|---|---|---|---|
| 2005 | 934 | 780 | 703 | 859 | 859 | 696 | 810 | 816 | 840 | 858 | 1,073 | 937 |
| 2006 | 860 | 728 | 617 | 808 | 850 | 841 | 840 | 835 | 826 | 772 | 848 | 870 |
| 2007 | 748 | 437 | 659 | 597 | 548 | 534 | 562 | 597 | 557 | 290 | 471 | 359 |
| 2008 | 410 | 387 | 355 | 441 | 504 | 459 | 387 | 341 | 339 | 372 | 305 | 294 |
| 2009 | 429 | 492 | 484 | 354 | 586 | 598 | 765 | 643 | 816 | 754 | 726 | 828 |
| 2010 | 958 | 946 | 809 | 783 | 908 | 943 | 1,019 | 961 | 899 | 910 | 875 | 985 |
| 2011 | 1,015 | 901 | 1,054 | 1,020 | 1,039 | 937 | 884 | 809 | 967 | 937 | 804 | 845 |
| 2012 | 884 | 825 | 835 | 848 | 932 | 889 | 815 | 778 | 681 | 733 | 706 | 769 |
| 2013 | 802 | 782 | 866 | 745 | 782 | 650 | 865 | 868 | 801 | 960 | 962 | 920 |
| 2014 | 890 | 853 | 597 | 620 | 714 | 722 | 752 | 865 | 780 | 679 | 870 | 1,018 |
| 2015 | 690 | 673 | 729 | 888 | 944 | 924 | 945 | 883 | 877 | 764 | 877 | 939 |
| 2016 | 927 | 867 | 900 | 895 | 946 | 908 | 832 | 925 | 863 | 790 | 795 | 860 |
| 2017 | 779 | 854 | 1,044 | 989 | 970 | 915 | 797 | 920 | 853 | 1,047 | 1,008 | 1,014 |
| 2018 | 886 | 842 | 843 | 953 | 982 | 865 | 973 | 939 | 886 | 763 | 887 | 1,032 |
| 2019 | 1,028 | 698 | 936 | 928 | 856 | 800 | 935 | 928 | 882 | 730 | 897 | 903 |
| 2020 | 980 | 931 | 875 | 873 | 744 | 737 | 806 | 868 | 945 | 893 | 839 | 916 |
| 2021 | 986 | 919 | 963 | 927 | 918 | 947 | 972 | 1,071 | 1,024 | 919 | 853 | 1,019 |
| 2022 | 955 | 869 | 899 | 842 | 895 | 884 | 945 | 907 | 772 | 630 | 679 | 706 |
| 2023 | 784 | 692 | 851 | 867 | 828 | 777 | 670 | 964 | 881 | 721 | 664 | 777 |
| 2024 | 855 | |||||||||||
| - = No Data Reported; -- = Not Applicable; NA = Not Available; W = Withheld to avoid disclosure of individual company data. |
| Release Date: 3/29/2024 |
| Next Release Date: 4/30/2024 |