|
Download Data (XLS File) |
|
||||||||
|
||||||||
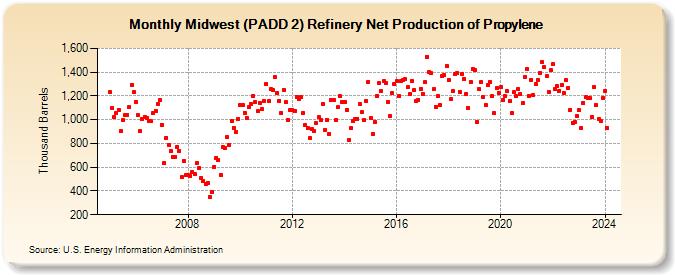
| Midwest (PADD 2) Refinery Net Production of Propylene (Thousand Barrels) | ||||||||
| Year | Jan | Feb | Mar | Apr | May | Jun | Jul | Aug | Sep | Oct | Nov | Dec |
|---|---|---|---|---|---|---|---|---|---|---|---|---|
| 2005 | 1,229 | 1,100 | 1,022 | 1,058 | 1,084 | 901 | 995 | 1,038 | 1,039 | 1,106 | 1,295 | 1,230 |
| 2006 | 1,151 | 1,036 | 902 | 1,008 | 1,024 | 1,012 | 991 | 986 | 1,060 | 1,071 | 1,136 | 1,164 |
| 2007 | 958 | 634 | 848 | 789 | 734 | 686 | 690 | 774 | 733 | 515 | 655 | 533 |
| 2008 | 533 | 524 | 560 | 542 | 632 | 590 | 511 | 484 | 459 | 470 | 351 | 390 |
| 2009 | 602 | 681 | 662 | 538 | 772 | 765 | 850 | 787 | 986 | 934 | 894 | 1,006 |
| 2010 | 1,125 | 1,126 | 1,059 | 1,013 | 1,104 | 1,132 | 1,201 | 1,150 | 1,071 | 1,144 | 1,088 | 1,156 |
| 2011 | 1,303 | 1,154 | 1,259 | 1,250 | 1,355 | 1,223 | 1,160 | 1,055 | 1,253 | 1,149 | 996 | 1,081 |
| 2012 | 1,083 | 1,072 | 1,195 | 1,178 | 1,188 | 1,058 | 952 | 928 | 846 | 918 | 903 | 969 |
| 2013 | 1,020 | 996 | 1,135 | 911 | 1,001 | 883 | 1,162 | 1,162 | 996 | 1,103 | 1,196 | 1,149 |
| 2014 | 1,148 | 1,084 | 829 | 929 | 987 | 1,003 | 1,007 | 1,129 | 1,061 | 999 | 1,157 | 1,318 |
| 2015 | 1,013 | 880 | 981 | 1,199 | 1,305 | 1,241 | 1,322 | 1,305 | 1,150 | 1,032 | 1,222 | 1,300 |
| 2016 | 1,325 | 1,198 | 1,323 | 1,336 | 1,339 | 1,271 | 1,213 | 1,327 | 1,247 | 1,153 | 1,167 | 1,261 |
| 2017 | 1,216 | 1,313 | 1,530 | 1,405 | 1,389 | 1,258 | 1,110 | 1,199 | 1,121 | 1,371 | 1,375 | 1,450 |
| 2018 | 1,333 | 1,175 | 1,238 | 1,381 | 1,394 | 1,237 | 1,387 | 1,342 | 1,219 | 1,098 | 1,315 | 1,425 |
| 2019 | 1,415 | 983 | 1,254 | 1,317 | 1,190 | 1,120 | 1,295 | 1,318 | 1,199 | 1,054 | 1,267 | 1,226 |
| 2020 | 1,275 | 1,166 | 1,197 | 1,239 | 1,159 | 1,055 | 1,230 | 1,196 | 1,255 | 1,216 | 1,141 | 1,361 |
| 2021 | 1,426 | 1,202 | 1,336 | 1,205 | 1,297 | 1,336 | 1,396 | 1,483 | 1,441 | 1,364 | 1,235 | 1,414 |
| 2022 | 1,466 | 1,260 | 1,280 | 1,243 | 1,292 | 1,227 | 1,331 | 1,265 | 1,084 | 975 | 981 | 1,033 |
| 2023 | 1,082 | 929 | 1,140 | 1,188 | 1,179 | 1,180 | 1,022 | 1,277 | 1,123 | 1,003 | 990 | 1,181 |
| 2024 | 1,242 | 928 | 1,243 | 1,309 | 1,303 | 1,112 | ||||||
| - = No Data Reported; -- = Not Applicable; NA = Not Available; W = Withheld to avoid disclosure of individual company data. |
| Release Date: 8/30/2024 |
| Next Release Date: 9/30/2024 |
Referring Pages: