|
Download Data (XLS File) |
|
||||||||
|
||||||||
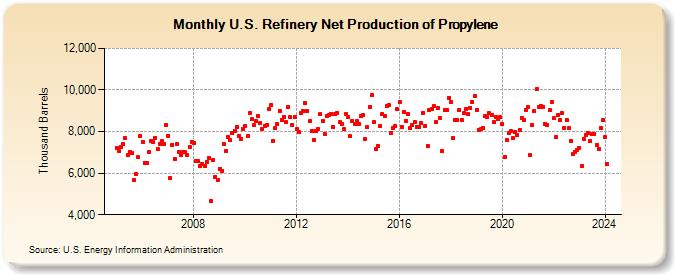
| U.S. Refinery Net Production of Propylene (Thousand Barrels) | ||||||||
| Year | Jan | Feb | Mar | Apr | May | Jun | Jul | Aug | Sep | Oct | Nov | Dec |
|---|---|---|---|---|---|---|---|---|---|---|---|---|
| 2005 | 7,215 | 7,061 | 7,274 | 7,382 | 7,667 | 6,879 | 7,040 | 6,973 | 5,653 | 5,963 | 6,754 | 7,791 |
| 2006 | 7,499 | 6,511 | 6,478 | 6,999 | 7,563 | 7,500 | 7,711 | 7,156 | 7,425 | 7,549 | 7,378 | 8,311 |
| 2007 | 7,779 | 5,762 | 7,361 | 6,697 | 7,397 | 7,027 | 6,870 | 7,038 | 6,997 | 6,860 | 7,281 | 7,514 |
| 2008 | 7,456 | 6,577 | 6,573 | 6,325 | 6,458 | 6,333 | 6,518 | 6,728 | 4,651 | 6,616 | 5,833 | 5,684 |
| 2009 | 6,221 | 6,118 | 7,409 | 7,084 | 7,748 | 7,570 | 7,907 | 8,021 | 8,219 | 7,798 | 7,630 | 8,109 |
| 2010 | 8,276 | 7,773 | 8,876 | 8,601 | 8,293 | 8,530 | 8,746 | 8,418 | 8,104 | 8,289 | 8,327 | 9,077 |
| 2011 | 9,281 | 7,525 | 8,156 | 8,364 | 9,005 | 8,576 | 8,724 | 8,444 | 9,192 | 8,684 | 8,329 | 8,704 |
| 2012 | 8,105 | 7,978 | 8,876 | 8,995 | 9,353 | 8,987 | 8,496 | 8,021 | 7,609 | 8,009 | 8,104 | 8,843 |
| 2013 | 8,503 | 7,871 | 8,764 | 8,789 | 8,847 | 8,210 | 8,837 | 8,910 | 8,438 | 8,343 | 8,103 | 8,855 |
| 2014 | 8,718 | 7,765 | 8,511 | 8,373 | 8,495 | 8,359 | 8,757 | 8,803 | 7,619 | 8,205 | 9,203 | 9,757 |
| 2015 | 8,452 | 7,145 | 7,329 | 8,268 | 8,831 | 8,737 | 9,229 | 9,265 | 7,915 | 8,156 | 8,245 | 9,074 |
| 2016 | 9,428 | 8,233 | 8,944 | 8,514 | 8,842 | 8,170 | 8,338 | 8,442 | 8,196 | 8,221 | 8,419 | 8,905 |
| 2017 | 8,255 | 7,327 | 9,029 | 9,103 | 9,229 | 8,473 | 9,141 | 8,670 | 7,051 | 9,022 | 9,036 | 9,626 |
| 2018 | 9,431 | 7,668 | 8,548 | 8,573 | 9,042 | 8,572 | 8,877 | 9,095 | 8,821 | 9,123 | 9,433 | 9,703 |
| 2019 | 9,047 | 8,080 | 8,106 | 8,151 | 8,770 | 8,705 | 8,879 | 8,808 | 8,449 | 8,708 | 8,614 | 8,687 |
| 2020 | 8,342 | 6,775 | 7,609 | 7,932 | 8,010 | 7,671 | 7,995 | 7,823 | 8,091 | 8,668 | 8,547 | 9,054 |
| 2021 | 9,179 | 6,855 | 8,292 | 8,973 | 10,045 | 9,192 | 9,247 | 9,173 | 8,362 | 8,339 | 9,024 | 9,444 |
| 2022 | 8,635 | 7,717 | 8,805 | 8,536 | 8,878 | 8,194 | 8,560 | 8,153 | 7,560 | 6,933 | 7,030 | 7,110 |
| 2023 | 7,229 | 6,332 | 7,663 | 7,828 | 7,945 | 7,557 | 7,900 | 7,899 | 7,361 | 7,151 | 8,192 | 8,548 |
| 2024 | 7,725 | |||||||||||
| - = No Data Reported; -- = Not Applicable; NA = Not Available; W = Withheld to avoid disclosure of individual company data. |
| Release Date: 3/29/2024 |
| Next Release Date: 4/30/2024 |
Referring Pages: