|
Download Data (XLS File) |
|
||||||||
|
||||||||
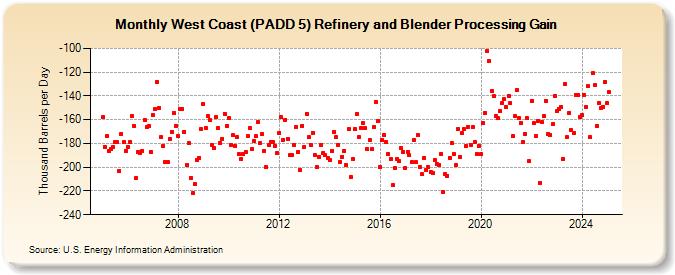
| West Coast (PADD 5) Refinery and Blender Processing Gain (Thousand Barrels per Day) | ||||||||
| Year | Jan | Feb | Mar | Apr | May | Jun | Jul | Aug | Sep | Oct | Nov | Dec |
|---|---|---|---|---|---|---|---|---|---|---|---|---|
| 2005 | -158 | -183 | -174 | -186 | -185 | -183 | -179 | -179 | -203 | -172 | -179 | -186 |
| 2006 | -183 | -179 | -157 | -165 | -209 | -187 | -188 | -186 | -160 | -166 | -165 | -187 |
| 2007 | -156 | -151 | -128 | -150 | -175 | -182 | -196 | -196 | -176 | -170 | -154 | -165 |
| 2008 | -174 | -151 | -151 | -170 | -198 | -180 | -209 | -222 | -214 | -194 | -192 | -168 |
| 2009 | -147 | -167 | -157 | -160 | -181 | -184 | -158 | -167 | -180 | -176 | -155 | -165 |
| 2010 | -159 | -181 | -173 | -182 | -175 | -189 | -193 | -189 | -187 | -174 | -167 | -185 |
| 2011 | -178 | -174 | -162 | -180 | -172 | -186 | -200 | -181 | -179 | -179 | -182 | -188 |
| 2012 | -171 | -158 | -177 | -160 | -176 | -190 | -190 | -181 | -166 | -187 | -202 | -165 |
| 2013 | -183 | -155 | -175 | -181 | -171 | -190 | -200 | -191 | -181 | -188 | -190 | -192 |
| 2014 | -194 | -186 | -170 | -175 | -181 | -196 | -191 | -186 | -198 | -168 | -208 | -193 |
| 2015 | -168 | -155 | -175 | -167 | -163 | -167 | -185 | -177 | -185 | -166 | -145 | -161 |
| 2016 | -200 | -177 | -173 | -179 | -189 | -193 | -215 | -201 | -193 | -195 | -184 | -187 |
| 2017 | -201 | -187 | -190 | -196 | -177 | -196 | -173 | -200 | -206 | -192 | -202 | -200 |
| 2018 | -204 | -205 | -194 | -197 | -198 | -189 | -221 | -206 | -207 | -192 | -180 | -189 |
| 2019 | -198 | -168 | -191 | -171 | -168 | -182 | -166 | -181 | -166 | -179 | -189 | -182 |
| 2020 | -189 | -163 | -154 | -102 | -111 | -136 | -140 | -157 | -159 | -153 | -146 | -143 |
| 2021 | -149 | -140 | -146 | -174 | -157 | -135 | -159 | -163 | -179 | -172 | -159 | -195 |
| 2022 | -144 | -163 | -174 | -161 | -213 | -162 | -157 | -144 | -172 | -173 | -164 | -140 |
| 2023 | -153 | -151 | -149 | -193 | -130 | -175 | -154 | -171 | -169 | -139 | -140 | -158 |
| 2024 | -156 | -139 | ||||||||||
| - = No Data Reported; -- = Not Applicable; NA = Not Available; W = Withheld to avoid disclosure of individual company data. |
| Release Date: 4/30/2024 |
| Next Release Date: 5/31/2024 |