|
Download Data (XLS File) |
|
||||||||
|
||||||||
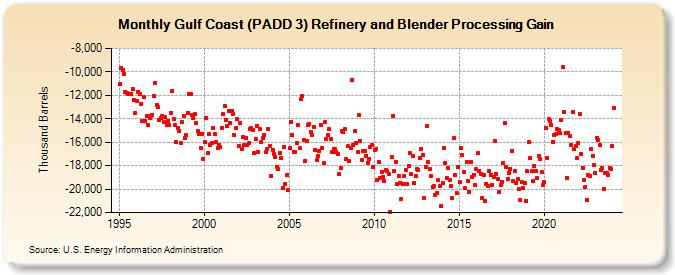
| Gulf Coast (PADD 3) Refinery and Blender Processing Gain (Thousand Barrels) | ||||||||
| Year | Jan | Feb | Mar | Apr | May | Jun | Jul | Aug | Sep | Oct | Nov | Dec |
|---|---|---|---|---|---|---|---|---|---|---|---|---|
| 1995 | -11,038 | -9,652 | -9,843 | -10,161 | -11,679 | -11,817 | -11,912 | -11,870 | -11,848 | -11,447 | -12,433 | -13,534 |
| 1996 | -12,509 | -11,711 | -11,890 | -12,738 | -14,204 | -12,110 | -14,157 | -13,727 | -14,551 | -13,902 | -13,780 | -13,641 |
| 1997 | -12,023 | -10,929 | -12,843 | -13,024 | -14,147 | -13,953 | -13,788 | -14,264 | -13,883 | -14,555 | -14,165 | -14,564 |
| 1998 | -13,480 | -11,602 | -14,016 | -14,545 | -15,995 | -14,758 | -15,006 | -16,079 | -14,267 | -13,742 | -15,666 | -15,396 |
| 1999 | -13,471 | -11,856 | -11,852 | -13,679 | -13,942 | -13,633 | -14,379 | -15,069 | -15,283 | -16,514 | -15,296 | -17,449 |
| 2000 | -16,009 | -13,916 | -16,942 | -15,337 | -16,210 | -16,062 | -14,813 | -15,264 | -15,960 | -16,519 | -16,260 | -16,376 |
| 2001 | -14,782 | -13,603 | -12,949 | -14,099 | -14,621 | -13,314 | -14,379 | -13,379 | -13,593 | -15,370 | -14,820 | -14,025 |
| 2002 | -16,306 | -14,334 | -16,558 | -15,597 | -16,247 | -15,609 | -16,250 | -16,097 | -14,869 | -14,809 | -14,935 | -16,928 |
| 2003 | -15,716 | -14,587 | -16,799 | -14,872 | -16,023 | -15,667 | -15,356 | -16,856 | -16,574 | -14,899 | -16,291 | -18,873 |
| 2004 | -16,672 | -17,010 | -17,234 | -18,084 | -18,248 | -16,929 | -17,327 | -19,911 | -16,405 | -19,590 | -18,802 | -20,104 |
| 2005 | -16,498 | -14,260 | -15,413 | -16,804 | -16,818 | -16,028 | -14,534 | -16,519 | -12,357 | -12,091 | -15,793 | -17,582 |
| 2006 | -15,934 | -14,529 | -14,456 | -15,128 | -15,416 | -14,680 | -16,624 | -17,559 | -17,214 | -16,750 | -14,522 | -16,474 |
| 2007 | -17,774 | -14,274 | -15,735 | -15,399 | -14,910 | -15,721 | -16,795 | -16,546 | -16,559 | -16,848 | -17,007 | -18,685 |
| 2008 | -18,172 | -15,082 | -15,166 | -14,896 | -17,397 | -16,330 | -17,593 | -16,504 | -10,703 | -16,221 | -15,087 | -16,110 |
| 2009 | -16,866 | -13,700 | -15,925 | -17,508 | -16,713 | -16,738 | -17,167 | -17,773 | -17,403 | -16,395 | -16,270 | -18,088 |
| 2010 | -16,627 | -16,543 | -19,240 | -17,722 | -19,020 | -18,545 | -18,965 | -19,314 | -18,361 | -18,419 | -18,685 | -21,925 |
| 2011 | -17,257 | -13,772 | -18,483 | -17,682 | -19,569 | -18,878 | -19,450 | -20,835 | -19,523 | -18,863 | -18,349 | -19,546 |
| 2012 | -18,010 | -16,927 | -18,752 | -17,193 | -19,509 | -18,854 | -18,280 | -18,360 | -17,347 | -16,556 | -17,101 | -20,752 |
| 2013 | -18,080 | -14,629 | -17,729 | -18,314 | -18,898 | -19,778 | -19,746 | -20,478 | -20,366 | -19,243 | -19,741 | -21,441 |
| 2014 | -19,484 | -16,482 | -17,783 | -19,041 | -18,175 | -19,193 | -19,758 | -20,768 | -15,617 | -18,804 | -20,328 | -18,120 |
| 2015 | -19,424 | -16,482 | -17,134 | -18,506 | -19,893 | -17,666 | -19,305 | -20,214 | -17,646 | -18,998 | -18,762 | -19,657 |
| 2016 | -18,317 | -16,959 | -18,420 | -18,675 | -20,777 | -18,806 | -21,039 | -19,562 | -19,729 | -18,463 | -18,788 | -19,619 |
| 2017 | -18,982 | -15,883 | -18,679 | -19,134 | -20,270 | -19,633 | -19,360 | -17,765 | -14,393 | -18,113 | -19,118 | -18,636 |
| 2018 | -18,247 | -16,752 | -19,290 | -18,422 | -19,513 | -19,171 | -20,026 | -20,931 | -19,406 | -19,934 | -19,506 | -20,980 |
| 2019 | -18,483 | -16,020 | -17,331 | -18,488 | -19,299 | -18,022 | -18,474 | -19,065 | -17,197 | -17,464 | -18,511 | -19,645 |
| 2020 | -19,375 | -14,830 | -17,334 | -14,056 | -14,205 | -14,552 | -15,996 | -15,392 | -15,333 | -14,837 | -14,926 | -15,247 |
| 2021 | -14,083 | -9,580 | -13,421 | -15,243 | -19,077 | -15,204 | -15,501 | -16,257 | -13,462 | -16,617 | -16,348 | -17,385 |
| 2022 | -16,057 | -13,555 | -16,986 | -18,182 | -19,211 | -19,790 | -20,903 | -18,819 | -18,885 | -16,601 | -17,162 | -17,976 |
| 2023 | -18,615 | -15,603 | -15,777 | -16,205 | -18,336 | -18,205 | -19,971 | -18,626 | -18,638 | -18,759 | -18,170 | -18,317 |
| 2024 | -16,339 | |||||||||||
| - = No Data Reported; -- = Not Applicable; NA = Not Available; W = Withheld to avoid disclosure of individual company data. |
| Release Date: 3/29/2024 |
| Next Release Date: 4/30/2024 |