|
Download Data (XLS File) |
|
||||||||
|
||||||||
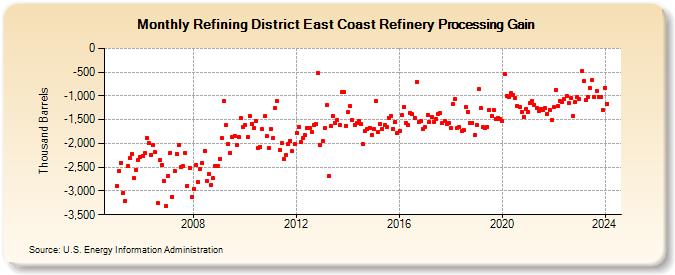
| Refining District East Coast Refinery Processing Gain (Thousand Barrels) | ||||||||
| Year | Jan | Feb | Mar | Apr | May | Jun | Jul | Aug | Sep | Oct | Nov | Dec |
|---|---|---|---|---|---|---|---|---|---|---|---|---|
| 2005 | -2,892 | -2,575 | -2,404 | -3,033 | -3,213 | -2,480 | -2,314 | -2,218 | -2,736 | -2,552 | -2,347 | -2,293 |
| 2006 | -2,267 | -2,211 | -1,883 | -1,999 | -2,234 | -2,024 | -2,187 | -3,264 | -2,358 | -2,453 | -2,797 | -3,317 |
| 2007 | -2,681 | -2,193 | -3,117 | -2,585 | -2,218 | -2,043 | -2,502 | -2,478 | -2,200 | -2,888 | -2,510 | -3,118 |
| 2008 | -2,954 | -2,453 | -2,822 | -2,534 | -2,411 | -2,156 | -2,795 | -2,638 | -2,870 | -2,734 | -2,468 | -2,472 |
| 2009 | -2,318 | -1,896 | -1,103 | -1,618 | -2,004 | -2,195 | -1,871 | -1,834 | -2,032 | -1,870 | -1,465 | -1,651 |
| 2010 | -1,608 | -1,861 | -1,426 | -1,588 | -1,678 | -1,532 | -2,100 | -2,077 | -1,705 | -1,433 | -1,853 | -2,095 |
| 2011 | -1,692 | -1,887 | -1,261 | -1,114 | -2,138 | -1,997 | -2,331 | -2,246 | -2,013 | -1,939 | -2,166 | -2,022 |
| 2012 | -1,788 | -1,645 | -1,977 | -1,877 | -1,828 | -1,676 | -1,681 | -1,769 | -1,614 | -1,589 | -522 | -2,030 |
| 2013 | -1,955 | -1,682 | -1,201 | -2,689 | -1,626 | -1,423 | -1,562 | -1,501 | -1,616 | -920 | -913 | -1,624 |
| 2014 | -1,341 | -1,221 | -1,500 | -1,607 | -1,576 | -1,533 | -1,594 | -2,021 | -1,734 | -1,697 | -1,665 | -1,817 |
| 2015 | -1,700 | -1,103 | -1,750 | -1,583 | -1,686 | -1,618 | -1,654 | -1,459 | -1,417 | -1,691 | -1,549 | -1,782 |
| 2016 | -1,729 | -1,412 | -1,226 | -1,564 | -1,618 | -1,353 | -1,386 | -1,457 | -702 | -1,546 | -1,523 | -1,692 |
| 2017 | -1,657 | -1,400 | -1,552 | -1,436 | -1,539 | -1,482 | -1,380 | -1,357 | -1,575 | -1,525 | -1,592 | -1,567 |
| 2018 | -1,685 | -1,167 | -1,071 | -1,683 | -1,654 | -1,742 | -1,722 | -1,236 | -1,333 | -1,565 | -1,564 | -1,830 |
| 2019 | -1,605 | -857 | -1,260 | -1,655 | -1,674 | -1,645 | -1,286 | -1,416 | -1,296 | -1,485 | -1,458 | -1,485 |
| 2020 | -1,524 | -535 | -995 | -1,021 | -946 | -979 | -1,035 | -1,206 | -1,239 | -1,337 | -1,436 | -1,267 |
| 2021 | -1,333 | -1,155 | -1,114 | -1,189 | -1,248 | -1,315 | -1,267 | -1,288 | -1,262 | -1,371 | -1,292 | -1,512 |
| 2022 | -1,239 | -874 | -1,208 | -1,116 | -1,133 | -1,063 | -1,012 | -1,153 | -1,048 | -1,431 | -1,123 | -1,015 |
| 2023 | -1,073 | -482 | -687 | -1,092 | -1,020 | -824 | -673 | -1,027 | -895 | -1,013 | -1,021 | -1,303 |
| 2024 | -823 | |||||||||||
| - = No Data Reported; -- = Not Applicable; NA = Not Available; W = Withheld to avoid disclosure of individual company data. |
| Release Date: 3/29/2024 |
| Next Release Date: 4/30/2024 |