|
Download Data (XLS File) |
|
||||||||
|
||||||||
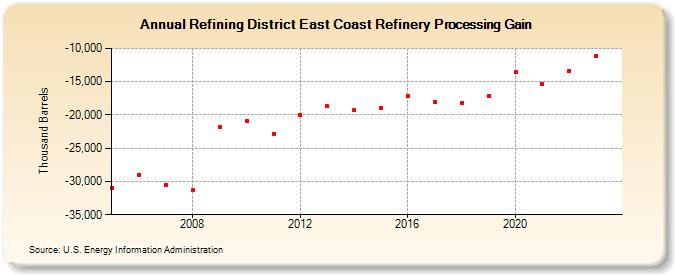
| Refining District East Coast Refinery Processing Gain (Thousand Barrels) | ||||||||
| Decade | Year-0 | Year-1 | Year-2 | Year-3 | Year-4 | Year-5 | Year-6 | Year-7 | Year-8 | Year-9 |
|---|---|---|---|---|---|---|---|---|---|---|
| 2000's | -31,057 | -28,994 | -30,533 | -31,307 | -21,857 | |||||
| 2010's | -20,956 | -22,806 | -19,996 | -18,712 | -19,306 | -18,992 | -17,208 | -18,062 | -18,252 | -17,122 |
| 2020's | -13,520 | -15,346 | -13,415 | -11,111 |
| - = No Data Reported; -- = Not Applicable; NA = Not Available; W = Withheld to avoid disclosure of individual company data. |
| Release Date: 8/30/2024 |
| Next Release Date: 8/29/2025 |