|
Download Data (XLS File) |
|
||||||||
|
||||||||
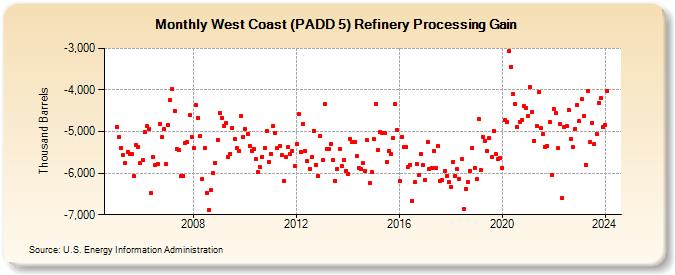
| West Coast (PADD 5) Refinery Processing Gain (Thousand Barrels) | ||||||||
| Year | Jan | Feb | Mar | Apr | May | Jun | Jul | Aug | Sep | Oct | Nov | Dec |
|---|---|---|---|---|---|---|---|---|---|---|---|---|
| 2005 | -4,885 | -5,131 | -5,388 | -5,571 | -5,747 | -5,481 | -5,540 | -5,541 | -6,078 | -5,322 | -5,369 | -5,768 |
| 2006 | -5,686 | -5,014 | -4,869 | -4,944 | -6,477 | -5,620 | -5,816 | -5,775 | -4,810 | -5,143 | -4,945 | -5,786 |
| 2007 | -4,848 | -4,239 | -3,977 | -4,498 | -5,419 | -5,447 | -6,065 | -6,071 | -5,266 | -5,260 | -4,613 | -5,125 |
| 2008 | -5,396 | -4,372 | -4,672 | -5,108 | -6,147 | -5,393 | -6,472 | -6,880 | -6,407 | -6,006 | -5,762 | -5,200 |
| 2009 | -4,550 | -4,665 | -4,871 | -4,800 | -5,612 | -5,528 | -4,908 | -5,176 | -5,397 | -5,463 | -4,637 | -5,130 |
| 2010 | -4,942 | -5,068 | -5,347 | -5,461 | -5,411 | -5,670 | -5,977 | -5,864 | -5,604 | -5,390 | -4,992 | -5,725 |
| 2011 | -5,529 | -4,870 | -5,028 | -5,393 | -5,338 | -5,568 | -6,201 | -5,612 | -5,371 | -5,541 | -5,467 | -5,836 |
| 2012 | -5,300 | -4,587 | -5,495 | -4,815 | -5,469 | -5,710 | -5,895 | -5,623 | -4,979 | -5,798 | -6,065 | -5,109 |
| 2013 | -5,686 | -4,342 | -5,419 | -5,424 | -5,292 | -5,689 | -6,188 | -5,900 | -5,418 | -5,835 | -5,687 | -5,942 |
| 2014 | -6,011 | -5,188 | -5,261 | -5,258 | -5,598 | -5,874 | -5,904 | -5,763 | -5,946 | -5,213 | -6,229 | -5,978 |
| 2015 | -5,185 | -4,331 | -5,432 | -5,017 | -5,034 | -5,026 | -5,729 | -5,469 | -5,545 | -5,151 | -4,343 | -4,971 |
| 2016 | -6,201 | -5,124 | -5,374 | -5,383 | -5,857 | -5,795 | -6,659 | -6,221 | -5,788 | -6,043 | -5,531 | -5,806 |
| 2017 | -6,174 | -5,244 | -5,897 | -5,871 | -5,470 | -5,884 | -5,344 | -6,194 | -6,166 | -5,959 | -6,057 | -6,221 |
| 2018 | -6,322 | -5,725 | -6,062 | -5,911 | -6,133 | -5,661 | -6,857 | -6,381 | -6,206 | -5,946 | -5,385 | -5,871 |
| 2019 | -6,150 | -4,707 | -5,934 | -5,136 | -5,217 | -5,468 | -5,156 | -5,612 | -4,987 | -5,540 | -5,665 | -5,639 |
| 2020 | -5,865 | -4,725 | -4,776 | -3,071 | -3,450 | -4,093 | -4,345 | -4,882 | -4,766 | -4,729 | -4,394 | -4,423 |
| 2021 | -4,620 | -3,928 | -4,518 | -5,218 | -4,862 | -4,054 | -4,917 | -5,066 | -5,360 | -5,340 | -4,773 | -6,047 |
| 2022 | -4,453 | -4,561 | -5,402 | -4,810 | -6,597 | -4,882 | -4,877 | -4,473 | -5,171 | -5,382 | -4,934 | -4,351 |
| 2023 | -4,747 | -4,227 | -4,615 | -5,797 | -4,030 | -5,255 | -4,785 | -5,300 | -5,069 | -4,303 | -4,199 | -4,897 |
| 2024 | -4,833 | |||||||||||
| - = No Data Reported; -- = Not Applicable; NA = Not Available; W = Withheld to avoid disclosure of individual company data. |
| Release Date: 3/29/2024 |
| Next Release Date: 4/30/2024 |