|
Download Data (XLS File) |
|
||||||||
|
||||||||
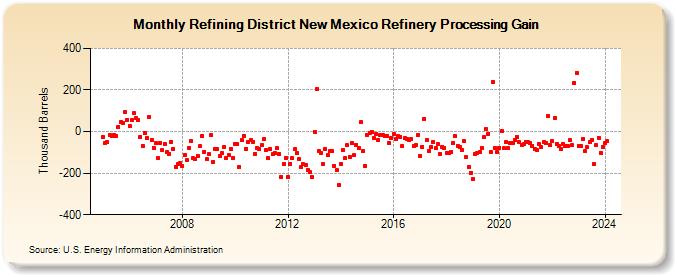
| Refining District New Mexico Refinery Processing Gain (Thousand Barrels) | ||||||||
| Year | Jan | Feb | Mar | Apr | May | Jun | Jul | Aug | Sep | Oct | Nov | Dec |
|---|---|---|---|---|---|---|---|---|---|---|---|---|
| 2005 | -25 | -57 | -52 | -18 | -22 | -15 | -21 | 24 | 45 | 43 | 93 | 57 |
| 2006 | 27 | 54 | 87 | 64 | 56 | -24 | -68 | -6 | -32 | 70 | -40 | -77 |
| 2007 | -57 | -127 | -55 | -91 | -58 | -99 | -106 | -49 | -85 | -170 | -154 | -153 |
| 2008 | -165 | -112 | -139 | -77 | -46 | -129 | -132 | -116 | -70 | -20 | -97 | -134 |
| 2009 | -109 | -18 | -145 | -82 | -86 | -118 | -104 | -72 | -125 | -114 | -83 | -126 |
| 2010 | -61 | -62 | -170 | -42 | -19 | -82 | -52 | -43 | -49 | -106 | -79 | -85 |
| 2011 | -67 | -36 | -89 | -129 | -83 | -109 | -104 | -81 | -106 | -219 | -154 | -126 |
| 2012 | -218 | -154 | -127 | -86 | -104 | -131 | -169 | -157 | -163 | -184 | -196 | -221 |
| 2013 | -3 | 205 | -95 | -102 | -155 | -86 | -114 | -95 | -94 | -164 | -187 | -257 |
| 2014 | -155 | -88 | -128 | -67 | -120 | -57 | -115 | -63 | -81 | 44 | -95 | -166 |
| 2015 | -16 | -5 | -3 | -31 | -12 | -40 | -16 | -18 | -21 | -19 | -53 | -31 |
| 2016 | -12 | -35 | -22 | -26 | -69 | -33 | -36 | -40 | -37 | -69 | -67 | -17 |
| 2017 | -117 | -72 | 62 | -41 | -93 | -73 | -51 | -81 | -61 | -107 | -73 | -78 |
| 2018 | -102 | -105 | -97 | -53 | -22 | -68 | -75 | -87 | -47 | -124 | -170 | -197 |
| 2019 | -226 | -108 | -101 | -99 | -77 | -28 | 12 | -10 | -98 | 239 | -81 | -98 |
| 2020 | -77 | 2 | -81 | -52 | -80 | -55 | -57 | -39 | -26 | -52 | -63 | -62 |
| 2021 | -48 | -52 | -57 | -68 | -83 | -91 | -58 | -76 | -51 | -54 | 75 | -66 |
| 2022 | -46 | 65 | -59 | -69 | -85 | -61 | -69 | -70 | -43 | -65 | 234 | 284 |
| 2023 | -68 | -70 | -37 | -95 | -76 | -51 | -40 | -155 | -66 | -29 | -101 | -73 |
| 2024 | -54 | |||||||||||
| - = No Data Reported; -- = Not Applicable; NA = Not Available; W = Withheld to avoid disclosure of individual company data. |
| Release Date: 3/29/2024 |
| Next Release Date: 4/30/2024 |