|
Download Data (XLS File) |
|
||||||||
|
||||||||
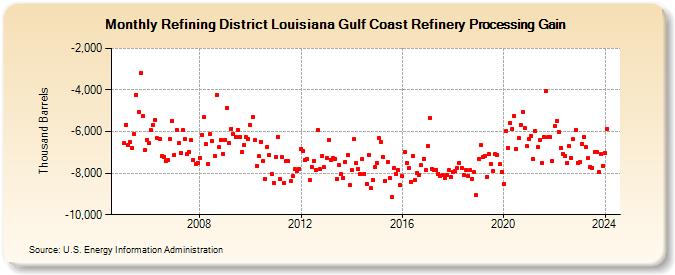
| Refining District Louisiana Gulf Coast Refinery Processing Gain (Thousand Barrels) | ||||||||
| Year | Jan | Feb | Mar | Apr | May | Jun | Jul | Aug | Sep | Oct | Nov | Dec |
|---|---|---|---|---|---|---|---|---|---|---|---|---|
| 2005 | -6,544 | -5,665 | -6,647 | -6,524 | -6,791 | -6,099 | -4,222 | -5,069 | -3,181 | -5,275 | -6,905 | -6,384 |
| 2006 | -6,564 | -5,944 | -5,671 | -5,422 | -6,332 | -6,377 | -7,181 | -7,202 | -7,408 | -7,361 | -6,348 | -5,472 |
| 2007 | -7,110 | -5,909 | -6,574 | -7,009 | -5,935 | -6,356 | -7,091 | -6,997 | -6,407 | -7,383 | -7,569 | -7,514 |
| 2008 | -7,258 | -6,142 | -5,322 | -6,600 | -7,545 | -6,138 | -6,446 | -7,185 | -4,226 | -6,758 | -6,401 | -7,060 |
| 2009 | -6,392 | -4,852 | -6,573 | -5,855 | -6,140 | -6,239 | -5,904 | -6,242 | -6,961 | -6,646 | -6,286 | -6,370 |
| 2010 | -5,675 | -5,297 | -6,427 | -7,651 | -7,195 | -6,483 | -7,427 | -8,270 | -6,722 | -7,129 | -8,039 | -8,454 |
| 2011 | -7,246 | -6,249 | -8,297 | -7,242 | -8,468 | -7,440 | -7,431 | -8,370 | -8,145 | -7,823 | -7,912 | -7,808 |
| 2012 | -6,816 | -6,931 | -7,381 | -7,338 | -8,344 | -7,700 | -7,398 | -7,845 | -5,935 | -7,814 | -7,156 | -7,728 |
| 2013 | -7,267 | -6,395 | -7,354 | -7,255 | -7,306 | -8,273 | -7,609 | -8,051 | -8,220 | -7,446 | -7,121 | -8,588 |
| 2014 | -7,829 | -6,379 | -7,523 | -7,781 | -8,040 | -7,297 | -8,030 | -8,519 | -7,122 | -8,734 | -8,339 | -7,720 |
| 2015 | -7,493 | -6,303 | -6,508 | -7,245 | -8,361 | -7,459 | -8,250 | -9,129 | -7,777 | -8,035 | -7,843 | -8,584 |
| 2016 | -8,155 | -6,975 | -7,501 | -7,760 | -8,406 | -7,165 | -8,354 | -7,982 | -8,071 | -7,625 | -7,301 | -7,851 |
| 2017 | -6,692 | -5,325 | -7,808 | -7,855 | -7,849 | -8,022 | -8,143 | -8,091 | -8,214 | -8,095 | -7,862 | -8,179 |
| 2018 | -7,959 | -7,912 | -7,742 | -7,497 | -7,744 | -8,076 | -7,827 | -8,135 | -7,868 | -8,280 | -7,960 | -9,069 |
| 2019 | -7,324 | -6,640 | -7,242 | -7,160 | -8,173 | -7,077 | -7,573 | -7,886 | -7,089 | -7,147 | -7,576 | -7,938 |
| 2020 | -8,522 | -5,975 | -6,781 | -5,573 | -5,893 | -5,239 | -6,830 | -6,320 | -5,666 | -5,058 | -5,847 | -6,710 |
| 2021 | -6,356 | -6,217 | -7,316 | -5,975 | -6,740 | -6,408 | -7,500 | -6,286 | -4,050 | -6,277 | -6,254 | -7,427 |
| 2022 | -5,721 | -5,483 | -6,009 | -6,774 | -7,063 | -7,198 | -7,497 | -6,713 | -7,268 | -6,361 | -5,904 | -7,489 |
| 2023 | -7,467 | -6,578 | -6,264 | -6,753 | -7,293 | -7,688 | -7,750 | -7,003 | -6,992 | -7,964 | -7,078 | -7,638 |
| 2024 | -7,023 | |||||||||||
| - = No Data Reported; -- = Not Applicable; NA = Not Available; W = Withheld to avoid disclosure of individual company data. |
| Release Date: 3/29/2024 |
| Next Release Date: 4/30/2024 |