|
Download Data (XLS File) |
|
||||||||
|
||||||||
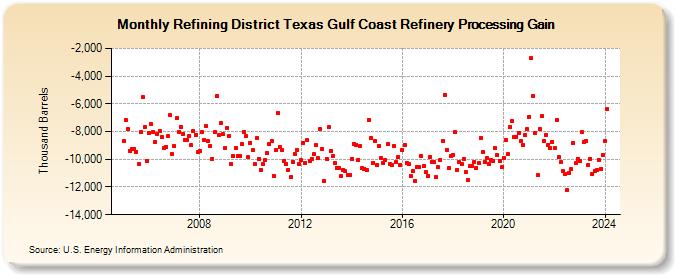
| Refining District Texas Gulf Coast Refinery Processing Gain (Thousand Barrels) | ||||||||
| Year | Jan | Feb | Mar | Apr | May | Jun | Jul | Aug | Sep | Oct | Nov | Dec |
|---|---|---|---|---|---|---|---|---|---|---|---|---|
| 2005 | -8,702 | -7,180 | -7,831 | -9,429 | -9,254 | -9,250 | -9,453 | -10,367 | -8,047 | -5,521 | -7,671 | -10,117 |
| 2006 | -8,090 | -7,479 | -8,021 | -8,750 | -8,154 | -7,955 | -8,384 | -9,154 | -9,082 | -8,323 | -6,837 | -9,653 |
| 2007 | -9,043 | -7,039 | -8,045 | -7,668 | -8,147 | -8,605 | -8,606 | -8,332 | -8,992 | -7,957 | -8,240 | -9,459 |
| 2008 | -9,410 | -8,057 | -8,620 | -7,583 | -8,655 | -9,041 | -9,965 | -8,056 | -5,463 | -8,256 | -7,383 | -8,209 |
| 2009 | -9,203 | -7,713 | -8,311 | -10,368 | -9,796 | -9,202 | -9,773 | -9,766 | -8,909 | -8,036 | -8,355 | -9,834 |
| 2010 | -8,800 | -9,349 | -10,361 | -8,481 | -9,953 | -10,738 | -10,363 | -10,063 | -9,546 | -8,885 | -8,655 | -11,175 |
| 2011 | -9,333 | -6,655 | -9,127 | -9,358 | -10,097 | -10,317 | -10,755 | -11,298 | -10,164 | -9,605 | -9,303 | -10,359 |
| 2012 | -10,073 | -8,813 | -10,240 | -8,637 | -10,149 | -9,965 | -9,645 | -9,003 | -9,935 | -7,784 | -9,250 | -11,578 |
| 2013 | -9,946 | -7,690 | -9,384 | -9,761 | -10,267 | -10,608 | -10,651 | -11,228 | -10,758 | -10,874 | -11,161 | -11,127 |
| 2014 | -9,975 | -8,880 | -8,937 | -10,046 | -9,032 | -10,663 | -10,673 | -10,758 | -7,142 | -8,484 | -10,255 | -8,693 |
| 2015 | -10,417 | -9,018 | -9,914 | -10,292 | -10,047 | -8,921 | -10,346 | -10,444 | -9,046 | -10,214 | -9,823 | -10,380 |
| 2016 | -9,356 | -8,960 | -10,268 | -10,325 | -11,182 | -10,856 | -11,553 | -10,573 | -10,582 | -9,766 | -10,514 | -10,948 |
| 2017 | -11,221 | -9,823 | -10,172 | -10,213 | -11,299 | -10,578 | -10,062 | -8,678 | -5,342 | -9,304 | -10,641 | -9,761 |
| 2018 | -9,665 | -8,055 | -10,758 | -10,202 | -10,352 | -9,966 | -10,945 | -11,494 | -10,473 | -10,507 | -10,212 | -10,616 |
| 2019 | -10,293 | -8,443 | -9,471 | -10,205 | -9,932 | -10,312 | -10,042 | -10,137 | -9,218 | -9,722 | -10,090 | -10,583 |
| 2020 | -9,873 | -8,604 | -9,620 | -7,658 | -7,236 | -8,377 | -8,357 | -8,082 | -8,705 | -8,965 | -8,279 | -7,826 |
| 2021 | -6,945 | -2,717 | -5,428 | -8,099 | -11,153 | -7,840 | -6,891 | -8,661 | -8,259 | -8,951 | -9,187 | -8,719 |
| 2022 | -9,198 | -7,180 | -9,872 | -10,232 | -10,855 | -11,040 | -12,213 | -10,964 | -10,735 | -8,820 | -10,267 | -9,952 |
| 2023 | -10,089 | -8,056 | -8,759 | -8,674 | -10,415 | -9,945 | -11,080 | -10,856 | -10,794 | -10,022 | -10,670 | -9,723 |
| 2024 | -8,703 | |||||||||||
| - = No Data Reported; -- = Not Applicable; NA = Not Available; W = Withheld to avoid disclosure of individual company data. |
| Release Date: 3/29/2024 |
| Next Release Date: 4/30/2024 |