|
Download Data (XLS File) |
|
||||||||
|
||||||||
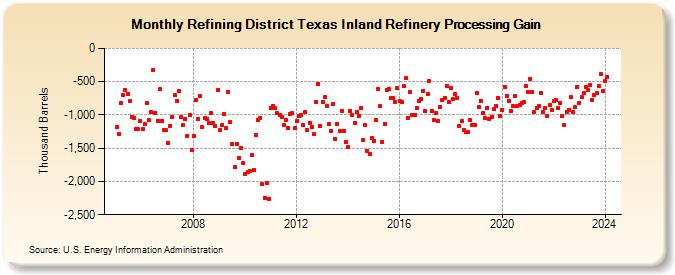
| Refining District Texas Inland Refinery Processing Gain (Thousand Barrels) | ||||||||
| Year | Jan | Feb | Mar | Apr | May | Jun | Jul | Aug | Sep | Oct | Nov | Dec |
|---|---|---|---|---|---|---|---|---|---|---|---|---|
| 2005 | -1,185 | -1,281 | -823 | -707 | -620 | -679 | -796 | -1,026 | -1,043 | -1,216 | -1,215 | -1,089 |
| 2006 | -1,217 | -1,138 | -819 | -1,078 | -956 | -327 | -967 | -1,086 | -616 | -1,084 | -1,224 | -1,231 |
| 2007 | -1,421 | -1,165 | -1,027 | -707 | -787 | -647 | -1,024 | -1,155 | -1,060 | -1,319 | -994 | -1,526 |
| 2008 | -1,311 | -775 | -1,058 | -722 | -1,179 | -1,044 | -1,056 | -1,123 | -977 | -1,117 | -1,166 | -632 |
| 2009 | -1,226 | -1,156 | -991 | -1,191 | -653 | -1,109 | -1,436 | -1,785 | -1,431 | -1,643 | -1,497 | -1,723 |
| 2010 | -1,886 | -1,860 | -1,845 | -1,605 | -1,833 | -1,300 | -1,075 | -1,049 | -2,045 | -2,245 | -2,030 | -2,261 |
| 2011 | -890 | -859 | -903 | -977 | -1,001 | -1,026 | -1,157 | -1,075 | -1,203 | -992 | -972 | -1,203 |
| 2012 | -1,095 | -1,016 | -1,005 | -1,159 | -962 | -1,227 | -1,117 | -1,178 | -1,293 | -805 | -534 | -1,167 |
| 2013 | -810 | -738 | -870 | -1,137 | -1,242 | -843 | -1,362 | -1,133 | -1,245 | -936 | -1,237 | -1,400 |
| 2014 | -1,478 | -942 | -1,004 | -1,114 | -953 | -1,014 | -891 | -1,382 | -1,157 | -1,548 | -1,581 | -1,342 |
| 2015 | -1,392 | -1,083 | -616 | -870 | -1,400 | -1,140 | -620 | -612 | -753 | -745 | -800 | -599 |
| 2016 | -790 | -811 | -567 | -449 | -1,043 | -662 | -998 | -999 | -890 | -787 | -767 | -638 |
| 2017 | -938 | -685 | -494 | -940 | -1,075 | -967 | -1,093 | -878 | -776 | -745 | -561 | -806 |
| 2018 | -594 | -768 | -686 | -739 | -1,166 | -1,092 | -1,224 | -1,250 | -1,260 | -1,075 | -1,146 | -1,158 |
| 2019 | -671 | -883 | -785 | -977 | -1,045 | -894 | -1,064 | -1,038 | -917 | -862 | -747 | -1,011 |
| 2020 | -924 | -573 | -711 | -785 | -940 | -867 | -718 | -869 | -853 | -828 | -807 | -562 |
| 2021 | -656 | -456 | -662 | -960 | -889 | -867 | -666 | -962 | -903 | -1,019 | -849 | -921 |
| 2022 | -787 | -779 | -896 | -824 | -1,011 | -1,156 | -949 | -919 | -737 | -951 | -882 | -575 |
| 2023 | -816 | -731 | -674 | -584 | -630 | -554 | -773 | -698 | -668 | -558 | -384 | -643 |
| 2024 | -494 | |||||||||||
| - = No Data Reported; -- = Not Applicable; NA = Not Available; W = Withheld to avoid disclosure of individual company data. |
| Release Date: 3/29/2024 |
| Next Release Date: 4/30/2024 |