|
Download Data (XLS File) |
|
||||||||
|
||||||||
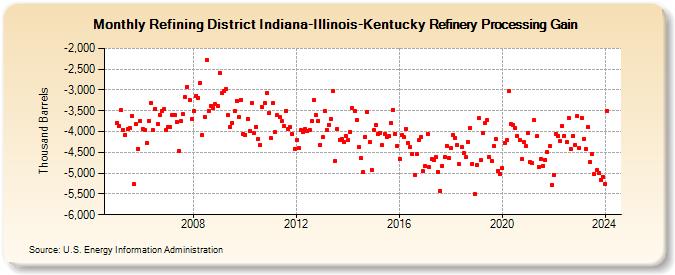
| Refining District Indiana-Illinois-Kentucky Refinery Processing Gain (Thousand Barrels) | ||||||||
| Year | Jan | Feb | Mar | Apr | May | Jun | Jul | Aug | Sep | Oct | Nov | Dec |
|---|---|---|---|---|---|---|---|---|---|---|---|---|
| 2005 | -3,793 | -3,860 | -3,488 | -3,952 | -4,075 | -3,944 | -3,925 | -3,628 | -5,272 | -3,824 | -4,409 | -3,736 |
| 2006 | -3,938 | -3,955 | -4,270 | -3,735 | -3,308 | -3,963 | -3,455 | -3,812 | -3,591 | -3,503 | -3,462 | -3,967 |
| 2007 | -3,896 | -3,880 | -3,594 | -3,591 | -3,767 | -4,463 | -3,751 | -3,588 | -3,175 | -2,918 | -3,231 | -3,696 |
| 2008 | -3,511 | -3,143 | -3,183 | -2,823 | -4,077 | -3,648 | -2,282 | -3,508 | -3,376 | -3,438 | -3,347 | -3,379 |
| 2009 | -2,584 | -3,077 | -3,033 | -2,979 | -3,602 | -3,882 | -3,787 | -3,511 | -3,266 | -3,651 | -3,239 | -4,047 |
| 2010 | -4,076 | -3,696 | -3,981 | -3,312 | -4,043 | -3,881 | -4,171 | -4,319 | -3,411 | -3,313 | -3,068 | -3,555 |
| 2011 | -4,162 | -3,312 | -4,019 | -3,611 | -3,661 | -3,754 | -3,857 | -3,494 | -3,939 | -3,885 | -4,063 | -4,419 |
| 2012 | -4,212 | -4,404 | -3,963 | -4,008 | -3,943 | -3,997 | -3,954 | -3,741 | -3,242 | -3,599 | -3,735 | -4,318 |
| 2013 | -4,143 | -3,501 | -3,956 | -3,831 | -3,702 | -3,024 | -4,706 | -3,933 | -4,194 | -4,181 | -4,257 | -4,110 |
| 2014 | -4,213 | -4,004 | -3,438 | -3,505 | -3,717 | -4,364 | -4,640 | -4,981 | -4,121 | -3,519 | -4,253 | -4,924 |
| 2015 | -3,970 | -3,846 | -4,061 | -4,026 | -4,334 | -4,053 | -4,127 | -4,118 | -3,800 | -3,478 | -4,049 | -4,347 |
| 2016 | -4,665 | -4,088 | -4,135 | -3,931 | -4,270 | -4,372 | -4,549 | -5,044 | -4,545 | -4,205 | -4,131 | -4,960 |
| 2017 | -4,829 | -4,061 | -4,854 | -4,672 | -4,688 | -4,619 | -4,966 | -5,426 | -4,828 | -4,618 | -4,337 | -4,633 |
| 2018 | -4,403 | -4,082 | -4,145 | -4,315 | -4,792 | -4,372 | -4,517 | -4,621 | -4,243 | -3,906 | -4,770 | -5,505 |
| 2019 | -4,799 | -3,684 | -4,693 | -4,035 | -3,796 | -3,722 | -4,612 | -4,697 | -4,338 | -4,181 | -4,938 | -5,017 |
| 2020 | -4,888 | -4,281 | -4,205 | -3,030 | -3,821 | -3,838 | -3,915 | -4,106 | -4,199 | -4,671 | -4,257 | -4,354 |
| 2021 | -4,043 | -4,742 | -4,760 | -3,728 | -4,115 | -4,855 | -4,660 | -4,822 | -4,676 | -4,501 | -4,348 | -5,285 |
| 2022 | -5,038 | -4,062 | -4,112 | -4,234 | -3,863 | -4,100 | -4,255 | -3,674 | -4,423 | -4,099 | -4,318 | -3,632 |
| 2023 | -4,407 | -3,668 | -4,169 | -4,423 | -3,892 | -4,725 | -4,536 | -5,027 | -4,931 | -4,997 | -5,165 | -5,084 |
| 2024 | -5,252 | |||||||||||
| - = No Data Reported; -- = Not Applicable; NA = Not Available; W = Withheld to avoid disclosure of individual company data. |
| Release Date: 3/29/2024 |
| Next Release Date: 4/30/2024 |