|
Download Data (XLS File) |
|
||||||||
|
||||||||
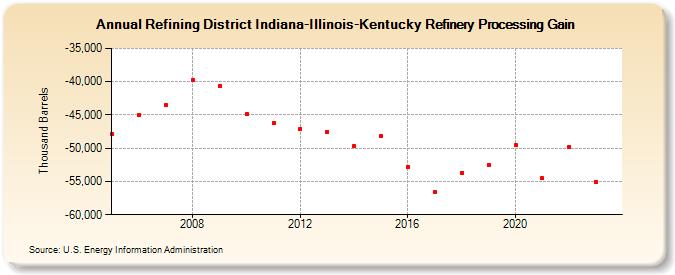
| Refining District Indiana-Illinois-Kentucky Refinery Processing Gain (Thousand Barrels) | ||||||||
| Decade | Year-0 | Year-1 | Year-2 | Year-3 | Year-4 | Year-5 | Year-6 | Year-7 | Year-8 | Year-9 |
|---|---|---|---|---|---|---|---|---|---|---|
| 2000's | -47,906 | -44,959 | -43,550 | -39,715 | -40,658 | |||||
| 2010's | -44,826 | -46,176 | -47,116 | -47,538 | -49,679 | -48,209 | -52,895 | -56,531 | -53,671 | -52,512 |
| 2020's | -49,565 | -54,535 | -49,810 | -55,024 |
| - = No Data Reported; -- = Not Applicable; NA = Not Available; W = Withheld to avoid disclosure of individual company data. |
| Release Date: 3/29/2024 |
| Next Release Date: 8/30/2024 |