|
Download Data (XLS File) |
|
||||||||
|
||||||||
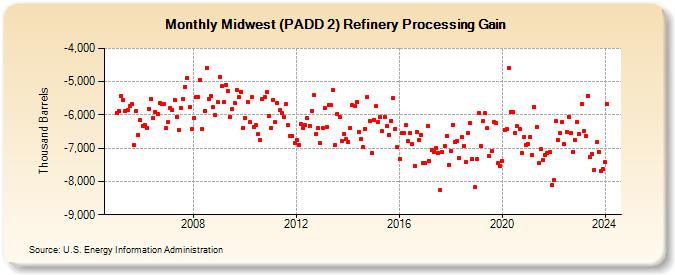
| Midwest (PADD 2) Refinery Processing Gain (Thousand Barrels) | ||||||||
| Year | Jan | Feb | Mar | Apr | May | Jun | Jul | Aug | Sep | Oct | Nov | Dec |
|---|---|---|---|---|---|---|---|---|---|---|---|---|
| 2005 | -5,936 | -5,888 | -5,438 | -5,564 | -5,890 | -5,852 | -5,739 | -5,674 | -6,905 | -5,876 | -6,592 | -6,153 |
| 2006 | -6,330 | -6,303 | -6,407 | -5,808 | -5,520 | -6,079 | -5,908 | -5,966 | -5,631 | -5,679 | -5,683 | -6,405 |
| 2007 | -6,207 | -5,790 | -5,859 | -5,548 | -6,048 | -6,460 | -5,790 | -5,511 | -5,154 | -4,878 | -5,775 | -6,420 |
| 2008 | -6,095 | -5,474 | -5,453 | -4,941 | -6,424 | -5,883 | -4,578 | -5,530 | -5,428 | -5,764 | -6,017 | -5,624 |
| 2009 | -4,858 | -5,132 | -5,620 | -5,089 | -5,271 | -6,066 | -5,825 | -5,647 | -5,255 | -5,470 | -5,296 | -6,391 |
| 2010 | -6,090 | -5,598 | -6,226 | -5,469 | -6,375 | -6,309 | -6,585 | -6,752 | -5,533 | -5,470 | -5,298 | -6,020 |
| 2011 | -6,391 | -5,550 | -6,216 | -5,648 | -5,867 | -5,952 | -6,056 | -5,678 | -6,302 | -6,620 | -6,637 | -6,858 |
| 2012 | -6,758 | -6,901 | -6,259 | -6,397 | -6,308 | -6,097 | -6,321 | -5,891 | -5,411 | -6,581 | -6,403 | -6,853 |
| 2013 | -6,386 | -5,787 | -6,358 | -5,696 | -5,707 | -5,258 | -6,915 | -5,958 | -6,063 | -6,792 | -6,569 | -6,737 |
| 2014 | -6,807 | -6,388 | -5,716 | -5,718 | -5,618 | -6,503 | -6,725 | -6,977 | -6,410 | -5,449 | -6,185 | -7,151 |
| 2015 | -6,144 | -5,732 | -6,226 | -6,077 | -6,485 | -6,075 | -6,340 | -6,608 | -6,172 | -5,492 | -6,414 | -6,965 |
| 2016 | -7,315 | -6,554 | -6,534 | -6,312 | -6,790 | -6,552 | -6,879 | -7,523 | -6,517 | -6,761 | -6,602 | -7,451 |
| 2017 | -7,458 | -6,340 | -7,391 | -7,052 | -7,104 | -6,986 | -7,136 | -8,268 | -7,121 | -6,948 | -6,628 | -7,504 |
| 2018 | -7,099 | -6,290 | -6,825 | -6,790 | -7,306 | -6,677 | -6,923 | -7,430 | -6,538 | -6,241 | -7,323 | -8,176 |
| 2019 | -7,321 | -5,947 | -6,938 | -6,180 | -5,950 | -6,401 | -7,246 | -7,081 | -6,207 | -6,238 | -7,447 | -7,531 |
| 2020 | -7,385 | -6,443 | -6,438 | -4,590 | -5,900 | -5,915 | -6,544 | -6,346 | -6,433 | -7,138 | -6,660 | -6,891 |
| 2021 | -6,875 | -6,670 | -7,194 | -5,753 | -6,360 | -7,457 | -7,036 | -7,357 | -7,210 | -7,146 | -7,119 | -8,113 |
| 2022 | -7,968 | -6,185 | -6,763 | -6,558 | -6,205 | -6,887 | -6,513 | -6,048 | -6,546 | -7,125 | -6,767 | -6,226 |
| 2023 | -6,791 | -5,663 | -6,496 | -6,657 | -5,438 | -7,285 | -7,105 | -7,651 | -6,795 | -7,013 | -7,693 | -7,620 |
| 2024 | -7,419 | -5,678 | -6,039 | -6,811 | -6,564 | -6,767 | ||||||
| - = No Data Reported; -- = Not Applicable; NA = Not Available; W = Withheld to avoid disclosure of individual company data. |
| Release Date: 8/30/2024 |
| Next Release Date: 9/30/2024 |