|
Download Data (XLS File) |
|
||||||||
|
||||||||
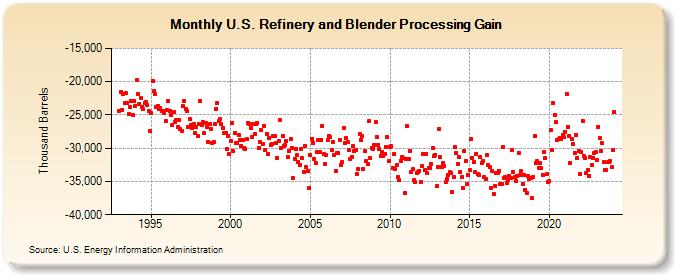
| U.S. Refinery and Blender Processing Gain (Thousand Barrels) | ||||||||
| Year | Jan | Feb | Mar | Apr | May | Jun | Jul | Aug | Sep | Oct | Nov | Dec |
|---|---|---|---|---|---|---|---|---|---|---|---|---|
| 1993 | -24,402 | -21,628 | -24,245 | -21,867 | -23,172 | -21,762 | -23,237 | -24,889 | -23,767 | -22,838 | -25,041 | -22,865 |
| 1994 | -23,614 | -19,725 | -21,788 | -23,337 | -22,453 | -23,757 | -24,179 | -23,134 | -23,088 | -23,468 | -24,430 | -27,349 |
| 1995 | -24,693 | -19,834 | -21,439 | -21,906 | -23,792 | -23,632 | -24,044 | -23,953 | -24,349 | -24,349 | -24,679 | -25,948 |
| 1996 | -24,242 | -22,914 | -24,347 | -24,978 | -26,520 | -24,575 | -26,083 | -25,745 | -26,802 | -25,725 | -27,162 | -27,350 |
| 1997 | -23,693 | -22,882 | -24,138 | -24,346 | -26,794 | -25,625 | -26,582 | -26,954 | -26,413 | -27,751 | -26,761 | -28,139 |
| 1998 | -26,344 | -22,947 | -26,510 | -26,111 | -27,784 | -26,215 | -26,810 | -28,998 | -26,383 | -27,053 | -29,185 | -29,107 |
| 1999 | -26,428 | -24,040 | -23,242 | -25,939 | -25,664 | -26,433 | -26,966 | -27,786 | -27,780 | -30,147 | -28,131 | -30,934 |
| 2000 | -28,963 | -26,162 | -30,461 | -27,660 | -29,255 | -29,175 | -28,052 | -28,831 | -29,631 | -28,704 | -29,910 | -30,088 |
| 2001 | -28,666 | -26,145 | -26,371 | -27,015 | -28,293 | -26,338 | -27,909 | -26,381 | -26,233 | -29,951 | -29,029 | -27,332 |
| 2002 | -29,332 | -26,650 | -30,289 | -27,854 | -30,831 | -28,443 | -29,479 | -29,326 | -28,140 | -28,149 | -29,159 | -31,493 |
| 2003 | -28,929 | -25,793 | -29,921 | -28,097 | -29,611 | -29,528 | -28,979 | -31,280 | -30,456 | -28,552 | -29,913 | -34,483 |
| 2004 | -31,634 | -30,166 | -31,078 | -32,144 | -32,506 | -30,160 | -31,483 | -33,566 | -29,636 | -32,877 | -33,497 | -35,951 |
| 2005 | -31,052 | -28,550 | -29,197 | -31,570 | -32,250 | -30,564 | -28,701 | -30,575 | -28,716 | -26,604 | -30,921 | -32,431 |
| 2006 | -31,038 | -28,795 | -28,109 | -28,326 | -30,338 | -29,038 | -30,985 | -33,382 | -30,793 | -30,754 | -28,766 | -32,486 |
| 2007 | -32,071 | -26,906 | -29,251 | -28,448 | -29,104 | -30,222 | -31,699 | -31,312 | -29,737 | -30,468 | -30,335 | -33,876 |
| 2008 | -33,191 | -27,907 | -28,810 | -28,135 | -33,070 | -30,412 | -31,957 | -32,375 | -25,956 | -31,511 | -30,009 | -30,067 |
| 2009 | -29,458 | -26,064 | -28,273 | -29,469 | -30,197 | -31,152 | -30,551 | -31,104 | -30,816 | -29,806 | -28,344 | -31,942 |
| 2010 | -29,782 | -29,682 | -32,974 | -30,829 | -33,138 | -32,540 | -34,367 | -34,827 | -31,858 | -31,376 | -31,537 | -36,785 |
| 2011 | -31,596 | -26,715 | -31,603 | -30,399 | -33,629 | -33,180 | -34,794 | -35,128 | -33,687 | -33,600 | -33,392 | -35,157 |
| 2012 | -32,657 | -30,863 | -33,300 | -30,799 | -33,771 | -32,989 | -33,030 | -32,401 | -30,032 | -31,183 | -30,962 | -35,727 |
| 2013 | -32,885 | -27,056 | -31,367 | -32,787 | -32,224 | -32,614 | -35,089 | -34,563 | -34,078 | -33,630 | -33,788 | -36,552 |
| 2014 | -34,326 | -29,802 | -30,736 | -32,339 | -31,400 | -33,645 | -34,323 | -36,043 | -30,463 | -31,880 | -35,331 | -34,100 |
| 2015 | -33,329 | -28,598 | -31,409 | -32,025 | -33,574 | -30,830 | -33,864 | -34,054 | -31,387 | -32,243 | -31,946 | -34,351 |
| 2016 | -34,615 | -31,041 | -32,523 | -32,853 | -35,971 | -33,419 | -36,898 | -35,612 | -33,671 | -33,754 | -33,377 | -35,443 |
| 2017 | -35,309 | -29,750 | -34,474 | -34,379 | -35,190 | -34,776 | -34,132 | -34,498 | -30,294 | -33,526 | -34,385 | -34,899 |
| 2018 | -34,175 | -30,702 | -33,968 | -33,398 | -35,384 | -33,987 | -36,236 | -36,750 | -34,226 | -34,583 | -34,483 | -37,521 |
| 2019 | -34,370 | -28,198 | -32,189 | -31,953 | -32,991 | -32,285 | -33,047 | -34,059 | -30,525 | -31,441 | -33,936 | -35,136 |
| 2020 | -34,971 | -27,299 | -30,198 | -23,212 | -25,049 | -26,120 | -28,789 | -28,641 | -28,442 | -28,653 | -28,033 | -28,363 |
| 2021 | -27,548 | -21,848 | -26,804 | -28,115 | -32,164 | -28,590 | -29,408 | -30,658 | -28,048 | -31,407 | -30,383 | -33,850 |
| 2022 | -30,643 | -25,873 | -31,126 | -31,505 | -33,688 | -33,327 | -34,115 | -31,314 | -32,460 | -31,428 | -30,699 | -30,557 |
| 2023 | -31,805 | -26,784 | -28,424 | -30,372 | -29,262 | -32,138 | -33,342 | -33,315 | -32,113 | -32,102 | -31,920 | -32,881 |
| 2024 | -30,292 | |||||||||||
| - = No Data Reported; -- = Not Applicable; NA = Not Available; W = Withheld to avoid disclosure of individual company data. |
| Release Date: 3/29/2024 |
| Next Release Date: 4/30/2024 |