|
Download Data (XLS File) |
|
||||||||
|
||||||||
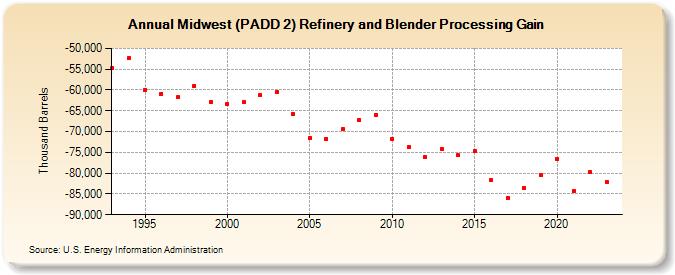
| Midwest (PADD 2) Refinery and Blender Processing Gain (Thousand Barrels) | ||||||||
| Decade | Year-0 | Year-1 | Year-2 | Year-3 | Year-4 | Year-5 | Year-6 | Year-7 | Year-8 | Year-9 |
|---|---|---|---|---|---|---|---|---|---|---|
| 1990's | -54,738 | -52,312 | -59,919 | -60,889 | -61,698 | -58,997 | -62,982 | |||
| 2000's | -63,444 | -62,990 | -61,235 | -60,462 | -65,810 | -71,507 | -71,719 | -69,440 | -67,211 | -65,920 |
| 2010's | -71,694 | -73,716 | -76,118 | -74,240 | -75,589 | -74,732 | -81,758 | -85,899 | -83,616 | -80,472 |
| 2020's | -76,661 | -84,250 | -79,760 | -82,088 |
| - = No Data Reported; -- = Not Applicable; NA = Not Available; W = Withheld to avoid disclosure of individual company data. |
| Release Date: 3/29/2024 |
| Next Release Date: 8/30/2024 |