|
Download Data (XLS File) |
|
||||||||
|
||||||||
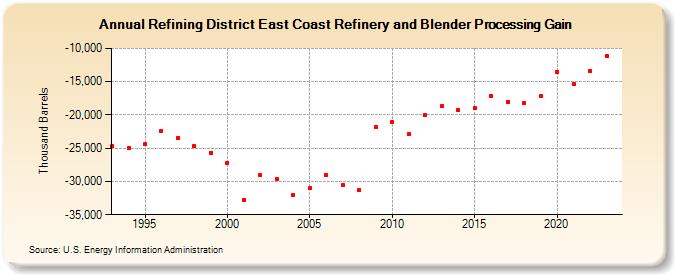
| Refining District East Coast Refinery and Blender Processing Gain (Thousand Barrels) | ||||||||
| Decade | Year-0 | Year-1 | Year-2 | Year-3 | Year-4 | Year-5 | Year-6 | Year-7 | Year-8 | Year-9 |
|---|---|---|---|---|---|---|---|---|---|---|
| 1990's | -24,742 | -25,032 | -24,430 | -22,390 | -23,452 | -24,723 | -25,661 | |||
| 2000's | -27,238 | -32,719 | -29,026 | -29,620 | -32,004 | -31,057 | -28,994 | -30,533 | -31,307 | -21,857 |
| 2010's | -21,051 | -22,824 | -20,027 | -18,679 | -19,264 | -18,984 | -17,212 | -18,058 | -18,228 | -17,151 |
| 2020's | -13,511 | -15,350 | -13,433 | -11,112 |
| - = No Data Reported; -- = Not Applicable; NA = Not Available; W = Withheld to avoid disclosure of individual company data. |
| Release Date: 3/29/2024 |
| Next Release Date: 8/30/2024 |