|
Download Data (XLS File) |
|
||||||||
|
||||||||
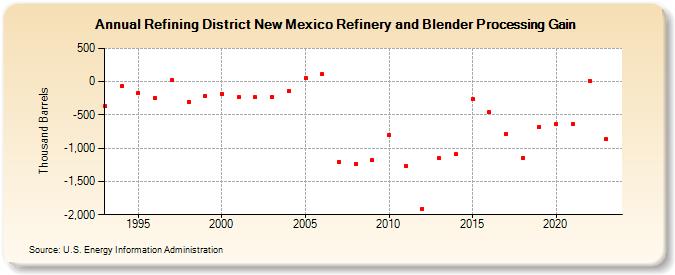
| Refining District New Mexico Refinery and Blender Processing Gain (Thousand Barrels) | ||||||||
| Decade | Year-0 | Year-1 | Year-2 | Year-3 | Year-4 | Year-5 | Year-6 | Year-7 | Year-8 | Year-9 |
|---|---|---|---|---|---|---|---|---|---|---|
| 1990's | -372 | -63 | -171 | -245 | 20 | -307 | -213 | |||
| 2000's | -179 | -236 | -237 | -230 | -144 | 52 | 111 | -1,204 | -1,237 | -1,182 |
| 2010's | -804 | -1,267 | -1,909 | -1,150 | -1,091 | -261 | -460 | -781 | -1,150 | -676 |
| 2020's | -641 | -629 | 15 | -849 |
| - = No Data Reported; -- = Not Applicable; NA = Not Available; W = Withheld to avoid disclosure of individual company data. |
| Release Date: 8/30/2024 |
| Next Release Date: 8/29/2025 |