|
Download Data (XLS File) |
|
||||||||
|
||||||||
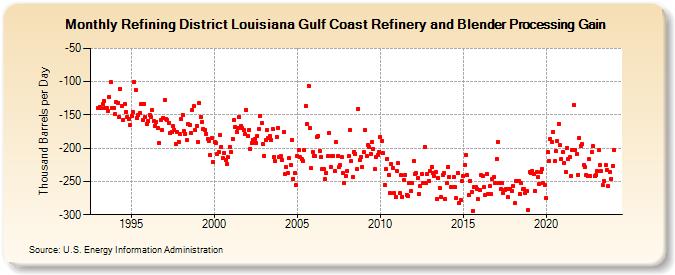
| Refining District Louisiana Gulf Coast Refinery and Blender Processing Gain (Thousand Barrels per Day) | ||||||||
| Year | Jan | Feb | Mar | Apr | May | Jun | Jul | Aug | Sep | Oct | Nov | Dec |
|---|---|---|---|---|---|---|---|---|---|---|---|---|
| 1993 | -139 | -138 | -140 | -133 | -129 | -140 | -140 | -144 | -123 | -101 | -139 | -139 |
| 1994 | -149 | -131 | -132 | -153 | -111 | -136 | -157 | -133 | -145 | -153 | -156 | -165 |
| 1995 | -151 | -145 | -100 | -112 | -155 | -150 | -147 | -133 | -158 | -133 | -153 | -163 |
| 1996 | -159 | -150 | -153 | -143 | -159 | -166 | -160 | -169 | -192 | -158 | -172 | -154 |
| 1997 | -127 | -156 | -158 | -162 | -177 | -176 | -167 | -172 | -194 | -175 | -190 | -179 |
| 1998 | -156 | -150 | -174 | -178 | -187 | -164 | -165 | -177 | -142 | -137 | -173 | -166 |
| 1999 | -190 | -132 | -153 | -161 | -171 | -172 | -179 | -186 | -189 | -210 | -185 | -221 |
| 2000 | -191 | -192 | -209 | -205 | -180 | -198 | -215 | -207 | -218 | -224 | -214 | -198 |
| 2001 | -206 | -186 | -158 | -168 | -175 | -170 | -153 | -166 | -169 | -173 | -179 | -142 |
| 2002 | -181 | -172 | -201 | -192 | -188 | -186 | -192 | -182 | -171 | -151 | -162 | -194 |
| 2003 | -211 | -188 | -172 | -185 | -182 | -188 | -171 | -213 | -220 | -183 | -169 | -214 |
| 2004 | -212 | -218 | -175 | -239 | -229 | -238 | -215 | -225 | -188 | -246 | -237 | -256 |
| 2005 | -211 | -202 | -214 | -217 | -219 | -203 | -136 | -164 | -106 | -170 | -230 | -206 |
| 2006 | -212 | -212 | -183 | -181 | -204 | -213 | -232 | -232 | -247 | -237 | -212 | -177 |
| 2007 | -229 | -211 | -212 | -234 | -191 | -212 | -229 | -226 | -214 | -238 | -252 | -242 |
| 2008 | -234 | -212 | -172 | -220 | -243 | -205 | -208 | -232 | -141 | -218 | -213 | -228 |
| 2009 | -206 | -173 | -212 | -195 | -198 | -208 | -190 | -201 | -232 | -214 | -210 | -205 |
| 2010 | -183 | -189 | -207 | -255 | -232 | -216 | -240 | -267 | -224 | -230 | -268 | -273 |
| 2011 | -234 | -223 | -268 | -241 | -273 | -248 | -240 | -270 | -272 | -252 | -264 | -252 |
| 2012 | -220 | -239 | -238 | -245 | -269 | -257 | -239 | -253 | -198 | -252 | -239 | -249 |
| 2013 | -234 | -228 | -237 | -242 | -236 | -276 | -245 | -260 | -274 | -240 | -237 | -277 |
| 2014 | -253 | -228 | -243 | -259 | -259 | -243 | -259 | -275 | -237 | -282 | -278 | -249 |
| 2015 | -242 | -225 | -210 | -241 | -270 | -249 | -266 | -294 | -259 | -259 | -261 | -277 |
| 2016 | -263 | -241 | -242 | -259 | -271 | -239 | -269 | -257 | -269 | -246 | -243 | -253 |
| 2017 | -216 | -190 | -252 | -262 | -253 | -267 | -263 | -261 | -274 | -261 | -262 | -264 |
| 2018 | -257 | -283 | -250 | -250 | -250 | -269 | -252 | -262 | -262 | -267 | -265 | -293 |
| 2019 | -236 | -237 | -234 | -239 | -264 | -236 | -244 | -254 | -236 | -231 | -253 | -256 |
| 2020 | -275 | -206 | -219 | -186 | -190 | -175 | -220 | -204 | -189 | -163 | -195 | -216 |
| 2021 | -205 | -222 | -236 | -199 | -217 | -214 | -242 | -203 | -135 | -202 | -208 | -240 |
| 2022 | -185 | -196 | -194 | -226 | -228 | -240 | -242 | -217 | -242 | -205 | -197 | -242 |
| 2023 | -241 | -235 | -202 | -225 | -235 | -256 | -250 | -226 | -233 | -257 | -236 | -246 |
| 2024 | -227 | -202 | ||||||||||
| - = No Data Reported; -- = Not Applicable; NA = Not Available; W = Withheld to avoid disclosure of individual company data. |
| Release Date: 4/30/2024 |
| Next Release Date: 5/31/2024 |