|
Download Data (XLS File) |
|
||||||||
|
||||||||
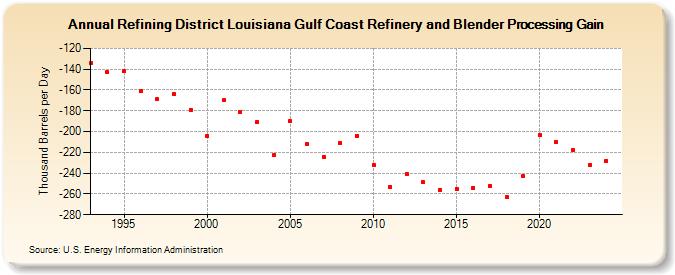
| Refining District Louisiana Gulf Coast Refinery and Blender Processing Gain (Thousand Barrels per Day) | ||||||||
| Decade | Year-0 | Year-1 | Year-2 | Year-3 | Year-4 | Year-5 | Year-6 | Year-7 | Year-8 | Year-9 |
|---|---|---|---|---|---|---|---|---|---|---|
| 1990's | -134 | -143 | -142 | -161 | -169 | -164 | -179 | |||
| 2000's | -204 | -170 | -181 | -191 | -223 | -190 | -212 | -224 | -211 | -204 |
| 2010's | -232 | -253 | -241 | -249 | -256 | -255 | -254 | -252 | -263 | -243 |
| 2020's | -203 | -210 | -218 | -237 |
| - = No Data Reported; -- = Not Applicable; NA = Not Available; W = Withheld to avoid disclosure of individual company data. |
| Release Date: 4/30/2024 |
| Next Release Date: 8/30/2024 |